SPECpower_ssj2008
Host 'user-296d48754e' Performance Report
Copyright © 2007-2011 Standard Performance Evaluation Corporation
| Hewlett-Packard Company ProLiant DL580 G5 (Historical) | ssj_ops@100% = 506,388 ssj_ops@100% per JVM = 63,298 |
||||
| Test Sponsor: | Intel Corp. | SPEC License #: | 3184 | Test Method: | Single Node |
| Tested By: | Principled Technologies, Inc. | Test Location: | Durham, NC, USA | Test Date: | Sep 2, 2010 |
| Hardware Availability: | Jan-2008 | Software Availability: | May-2009 | Publication: | Feb 23, 2011 |
| System Source: | Single Supplier | System Designation: | Server | Power Provisioning: | Line-powered |
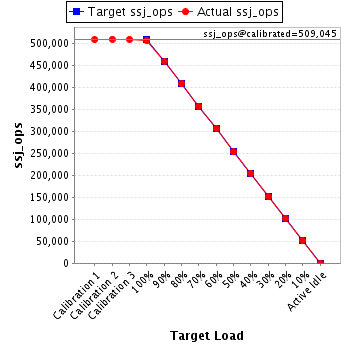
| Target Load | Actual Load | ssj_ops | |
|---|---|---|---|
| Target | Actual | ||
| Calibration 1 | 508,161 | ||
| Calibration 2 | 509,079 | ||
| Calibration 3 | 509,010 | ||
| ssj_ops@calibrated=509,045 | |||
| 100% | 99.5% | 509,045 | 506,388 |
| 90% | 90.0% | 458,140 | 458,389 |
| 80% | 80.1% | 407,236 | 407,494 |
| 70% | 70.1% | 356,331 | 356,984 |
| 60% | 60.0% | 305,427 | 305,461 |
| 50% | 49.7% | 254,522 | 252,771 |
| 40% | 40.1% | 203,618 | 203,897 |
| 30% | 29.8% | 152,713 | 151,489 |
| 20% | 20.2% | 101,809 | 102,587 |
| 10% | 10.1% | 50,904 | 51,498 |
| Active Idle | 0 | 0 | |
| Set Identifier: | sut |
| Set Description: | ProLiant DL580 G5 |
| # of Identical Nodes: | 1 |
| Comment: | None |
| Hardware | |
|---|---|
| Hardware Vendor: | Hewlett-Packard Company |
| Model: | ProLiant DL580 G5 (Historical) |
| Form Factor: | 4U |
| CPU Name: | Intel Xeon Processor E7330 |
| CPU Characteristics: | Quad-Core, 2.40 GHz, 6 MB L2 Cache, 1066 MHz system bus |
| CPU Frequency (MHz): | 2400 |
| CPU(s) Enabled: | 16 cores, 4 chips, 4 cores/chip |
| Hardware Threads: | 16 (1 / core) |
| CPU(s) Orderable: | 4 chips |
| Primary Cache: | 32 KB I + 32 KB D on chip per core |
| Secondary Cache: | 6 MB I+D on chip per chip |
| Tertiary Cache: | None |
| Other Cache: | None |
| Memory Amount (GB): | 64 |
| # and size of DIMM: | 16 x 4096 MB |
| Memory Details: | 4GB 2Rx4 PC2-5300F ECC CL5; all slots populated |
| Power Supply Quantity and Rating (W): | 2 x 1200 |
| Power Supply Details: | HP part #438202-001 |
| Disk Drive: | 2 x 72GB 15K RPM SAS RAID 1 |
| Disk Controller: | HP Smart Array P400 with 512MB RAM |
| # and type of Network Interface Cards (NICs) Installed: | 2 x NC373i Multifunction Gigabit Network Adapters |
| NICs Enabled in Firmware / OS / Connected: | 2/2/1 |
| Network Speed (Mbit): | 1000 |
| Keyboard: | KVM |
| Mouse: | KVM |
| Monitor: | KVM |
| Optical Drives: | Yes |
| Other Hardware: | None |
| Software | |
|---|---|
| Power Management: | Enabled (see SUT Notes) |
| Operating System (OS): | Microsoft Windows Server 2003 R2, Enterprise x64 Edition |
| OS Version: | SP2, Build 3790 |
| Filesystem: | NTFS |
| JVM Vendor: | Oracle Corporation |
| JVM Version: | Oracle JRockit(R) (build P28.0.0-29-114096-1.6.0_11-20090427-1759-windows-x86_64, compiled mode) |
| JVM Command-line Options: | -Xms3700m -Xmx3700m -Xns3200m -XXaggressive -XXlargePages -XXthroughputCompaction -XXcallprofiling -XXlazyUnlocking -Xgc:genpar -XXgcthreads:2 -XXtlasize:min=4k,preferred=512k -XX:+UseStringCache |
| JVM Affinity: | start /affinity [3, C, 30, C0, 300, C00, 3000, C000] |
| JVM Instances: | 8 |
| JVM Initial Heap (MB): | 3700 |
| JVM Maximum Heap (MB): | 3700 |
| JVM Address Bits: | 64 |
| Boot Firmware Version: | P61 2009.07.10 |
| Management Firmware Version: | 1.50 03/12/2008 |
| Workload Version: | SSJ 1.2.6 |
| Director Location: | Controller |
| Other Software: | None |
This benchmark result is intended to provide perspective on past power and/or performance using the historical hardware and/or software described on this result page.
The system as described on this result page was formerly generally available. At the time of this publication, it may not be shipping, and/or may not be supported, and/or may fail to meet other tests of General Availability described in the SPEC OSG Policy document, http://www.spec.org/osg/policy.html
This measured result may not be representative of the result that would be measured were this benchmark run with hardware and software available as of the publication date.
| JVM Instance | ssj_ops@100% |
|---|---|
| user-296d48754e.001 | 63,619 |
| user-296d48754e.002 | 63,938 |
| user-296d48754e.003 | 63,721 |
| user-296d48754e.004 | 63,570 |
| user-296d48754e.005 | 61,856 |
| user-296d48754e.006 | 63,572 |
| user-296d48754e.007 | 62,727 |
| user-296d48754e.008 | 63,383 |
| ssj_ops@100% | 506,388 |
| ssj_ops@100% per JVM | 63,298 |

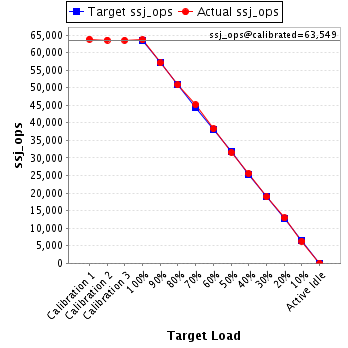
| Target Load | Actual Load | ssj_ops | |
|---|---|---|---|
| Target | Actual | ||
| Calibration 1 | 63,822 | ||
| Calibration 2 | 63,582 | ||
| Calibration 3 | 63,515 | ||
| ssj_ops@calibrated=63,549 | |||
| 100% | 100.1% | 63,549 | 63,619 |
| 90% | 89.8% | 57,194 | 57,066 |
| 80% | 80.0% | 50,839 | 50,818 |
| 70% | 71.0% | 44,484 | 45,151 |
| 60% | 60.2% | 38,129 | 38,288 |
| 50% | 49.7% | 31,774 | 31,583 |
| 40% | 40.2% | 25,419 | 25,575 |
| 30% | 29.8% | 19,065 | 18,912 |
| 20% | 20.3% | 12,710 | 12,900 |
| 10% | 9.9% | 6,355 | 6,283 |
| Active Idle | 0 | 0 | |
| Target Load | Actual Load | ssj_ops | |
|---|---|---|---|
| Target | Actual | ||
| Calibration 1 | 63,237 | ||
| Calibration 2 | 63,493 | ||
| Calibration 3 | 63,938 | ||
| ssj_ops@calibrated=63,716 | |||
| 100% | 100.3% | 63,716 | 63,938 |
| 90% | 90.5% | 57,344 | 57,656 |
| 80% | 80.4% | 50,972 | 51,218 |
| 70% | 69.5% | 44,601 | 44,271 |
| 60% | 59.5% | 38,229 | 37,886 |
| 50% | 49.8% | 31,858 | 31,726 |
| 40% | 40.1% | 25,486 | 25,542 |
| 30% | 29.7% | 19,115 | 18,914 |
| 20% | 19.9% | 12,743 | 12,658 |
| 10% | 10.1% | 6,372 | 6,454 |
| Active Idle | 0 | 0 | |

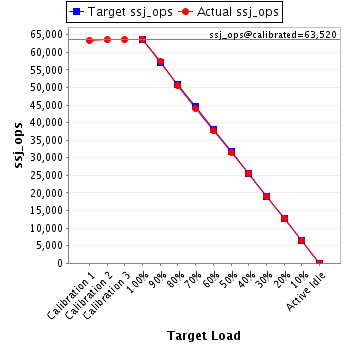
| Target Load | Actual Load | ssj_ops | |
|---|---|---|---|
| Target | Actual | ||
| Calibration 1 | 63,350 | ||
| Calibration 2 | 63,518 | ||
| Calibration 3 | 63,522 | ||
| ssj_ops@calibrated=63,520 | |||
| 100% | 100.3% | 63,520 | 63,721 |
| 90% | 90.4% | 57,168 | 57,415 |
| 80% | 79.7% | 50,816 | 50,614 |
| 70% | 69.3% | 44,464 | 44,014 |
| 60% | 59.2% | 38,112 | 37,627 |
| 50% | 49.5% | 31,760 | 31,473 |
| 40% | 40.4% | 25,408 | 25,657 |
| 30% | 29.9% | 19,056 | 18,978 |
| 20% | 20.2% | 12,704 | 12,811 |
| 10% | 10.1% | 6,352 | 6,425 |
| Active Idle | 0 | 0 | |
| Target Load | Actual Load | ssj_ops | |
|---|---|---|---|
| Target | Actual | ||
| Calibration 1 | 64,139 | ||
| Calibration 2 | 63,846 | ||
| Calibration 3 | 64,234 | ||
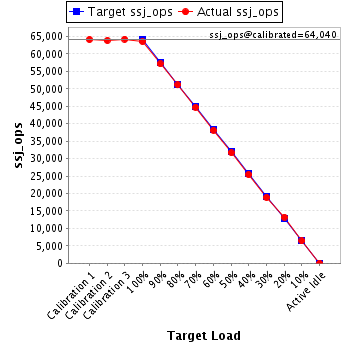
| ssj_ops@calibrated=64,040 | |||
| 100% | 99.3% | 64,040 | 63,570 |
| 90% | 89.2% | 57,636 | 57,147 |
| 80% | 79.9% | 51,232 | 51,137 |
| 70% | 69.9% | 44,828 | 44,740 |
| 60% | 59.6% | 38,424 | 38,171 |
| 50% | 49.4% | 32,020 | 31,667 |
| 40% | 39.7% | 25,616 | 25,412 |
| 30% | 29.5% | 19,212 | 18,871 |
| 20% | 20.7% | 12,808 | 13,241 |
| 10% | 10.0% | 6,404 | 6,400 |
| Active Idle | 0 | 0 | |
| Target Load | Actual Load | ssj_ops | |
|---|---|---|---|
| Target | Actual | ||
| Calibration 1 | 63,710 | ||
| Calibration 2 | 63,245 | ||
| Calibration 3 | 62,705 | ||
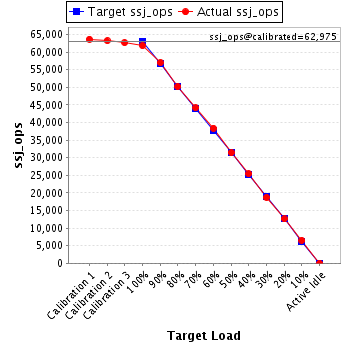
| ssj_ops@calibrated=62,975 | |||
| 100% | 98.2% | 62,975 | 61,856 |
| 90% | 90.6% | 56,678 | 57,042 |
| 80% | 79.7% | 50,380 | 50,222 |
| 70% | 70.1% | 44,083 | 44,154 |
| 60% | 61.0% | 37,785 | 38,420 |
| 50% | 50.0% | 31,488 | 31,466 |
| 40% | 40.3% | 25,190 | 25,400 |
| 30% | 29.8% | 18,893 | 18,739 |
| 20% | 20.0% | 12,595 | 12,590 |
| 10% | 10.4% | 6,298 | 6,529 |
| Active Idle | 0 | 0 | |
| Target Load | Actual Load | ssj_ops | |
|---|---|---|---|
| Target | Actual | ||
| Calibration 1 | 63,671 | ||
| Calibration 2 | 63,811 | ||
| Calibration 3 | 63,691 | ||
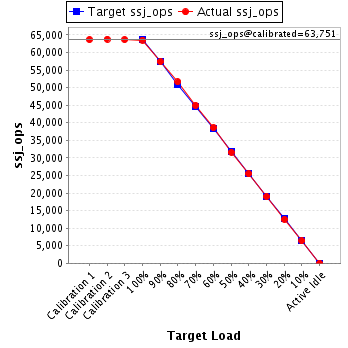
| ssj_ops@calibrated=63,751 | |||
| 100% | 99.7% | 63,751 | 63,572 |
| 90% | 90.0% | 57,376 | 57,399 |
| 80% | 81.0% | 51,001 | 51,635 |
| 70% | 70.6% | 44,625 | 44,997 |
| 60% | 60.5% | 38,250 | 38,576 |
| 50% | 49.6% | 31,875 | 31,618 |
| 40% | 39.9% | 25,500 | 25,445 |
| 30% | 29.8% | 19,125 | 19,008 |
| 20% | 19.6% | 12,750 | 12,487 |
| 10% | 10.1% | 6,375 | 6,417 |
| Active Idle | 0 | 0 | |
| Target Load | Actual Load | ssj_ops | |
|---|---|---|---|
| Target | Actual | ||
| Calibration 1 | 62,711 | ||
| Calibration 2 | 63,622 | ||
| Calibration 3 | 63,357 | ||
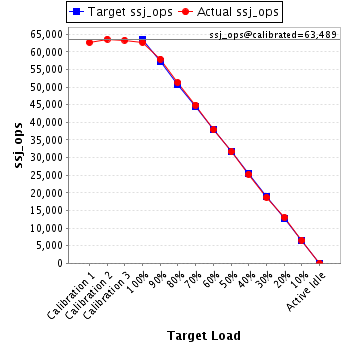
| ssj_ops@calibrated=63,489 | |||
| 100% | 98.8% | 63,489 | 62,727 |
| 90% | 91.3% | 57,140 | 57,984 |
| 80% | 80.8% | 50,791 | 51,307 |
| 70% | 70.8% | 44,442 | 44,919 |
| 60% | 59.7% | 38,094 | 37,922 |
| 50% | 49.9% | 31,745 | 31,689 |
| 40% | 39.8% | 25,396 | 25,285 |
| 30% | 29.5% | 19,047 | 18,730 |
| 20% | 20.6% | 12,698 | 13,058 |
| 10% | 10.3% | 6,349 | 6,545 |
| Active Idle | 0 | 0 | |
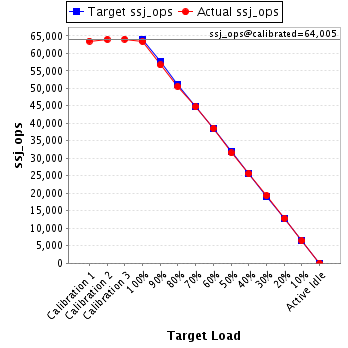
| Target Load | Actual Load | ssj_ops | |
|---|---|---|---|
| Target | Actual | ||
| Calibration 1 | 63,521 | ||
| Calibration 2 | 63,962 | ||
| Calibration 3 | 64,049 | ||
| ssj_ops@calibrated=64,005 | |||
| 100% | 99.0% | 64,005 | 63,383 |
| 90% | 88.6% | 57,605 | 56,682 |
| 80% | 79.0% | 51,204 | 50,542 |
| 70% | 69.9% | 44,804 | 44,736 |
| 60% | 60.3% | 38,403 | 38,571 |
| 50% | 49.3% | 32,003 | 31,549 |
| 40% | 40.0% | 25,602 | 25,581 |
| 30% | 30.2% | 19,202 | 19,336 |
| 20% | 20.1% | 12,801 | 12,840 |
| 10% | 10.1% | 6,401 | 6,446 |
| Active Idle | 0 | 0 | |