SPECpower_ssj2008
Host 'WIN-T1KAA1S9AGU' Performance Report
Copyright © 2007-2011 Standard Performance Evaluation Corporation
| Hewlett-Packard Company ProLiant DL580 G4 | ssj_ops@100% = 148,741 ssj_ops@100% per JVM = 37,185 |
||||
| Test Sponsor: | Intel Corp. | SPEC License #: | 3184 | Test Method: | Single Node |
| Tested By: | Principled Technologies, Inc. | Test Location: | Durham, NC, USA | Test Date: | Jan 20, 2011 |
| Hardware Availability: | Aug-2006 | Software Availability: | May-2009 | Publication: | Feb 17, 2011 |
| System Source: | Single Supplier | System Designation: | Server | Power Provisioning: | Line-powered |
| Target Load | Actual Load | ssj_ops | |
|---|---|---|---|
| Target | Actual | ||
| Calibration 1 | 148,664 | ||
| Calibration 2 | 149,618 | ||
| Calibration 3 | 150,337 | ||
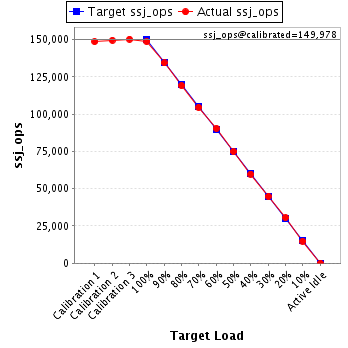
| ssj_ops@calibrated=149,978 | |||
| 100% | 99.2% | 149,978 | 148,741 |
| 90% | 89.6% | 134,980 | 134,366 |
| 80% | 79.4% | 119,982 | 119,107 |
| 70% | 69.7% | 104,984 | 104,576 |
| 60% | 60.3% | 89,987 | 90,456 |
| 50% | 50.0% | 74,989 | 74,987 |
| 40% | 39.9% | 59,991 | 59,860 |
| 30% | 29.9% | 44,993 | 44,863 |
| 20% | 20.4% | 29,996 | 30,563 |
| 10% | 9.9% | 14,998 | 14,880 |
| Active Idle | 0 | 0 | |
| Set Identifier: | sut |
| Set Description: | ProLiant DL580 G4 |
| # of Identical Nodes: | 1 |
| Comment: | None |
| Hardware | |
|---|---|
| Hardware Vendor: | Hewlett-Packard Company |
| Model: | ProLiant DL580 G4 |
| Form Factor: | 4U |
| CPU Name: | Intel Xeon Processor 7110M |
| CPU Characteristics: | Dual-Core, 2.60 GHz, 4 MB L2 Cache, 800 MHz system bus |
| CPU Frequency (MHz): | 2600 |
| CPU(s) Enabled: | 8 cores, 4 chips, 2 cores/chip |
| Hardware Threads: | 16 (2 / core) |
| CPU(s) Orderable: | 4 chips |
| Primary Cache: | 16 KB I + 16 KB D on chip per core |
| Secondary Cache: | 4 MB I+D on chip per chip |
| Tertiary Cache: | None |
| Other Cache: | None |
| Memory Amount (GB): | 16 |
| # and size of DIMM: | 16 x 1024 MB |
| Memory Details: | 1GB 1Rx4 PC2-3200R; all slots populated |
| Power Supply Quantity and Rating (W): | 2 x 1300 |
| Power Supply Details: | HP part #337867-501 |
| Disk Drive: | 2 x 146GB 10K RPM SAS RAID 1 |
| Disk Controller: | HP Smart Array P400 with 512MB of RAM |
| # and type of Network Interface Cards (NICs) Installed: | 2 x NC371i Multifunction Gigabit Network Adapters |
| NICs Enabled in Firmware / OS / Connected: | 2/1/1 |
| Network Speed (Mbit): | 1000 |
| Keyboard: | KVM |
| Mouse: | KVM |
| Monitor: | KVM |
| Optical Drives: | Yes |
| Other Hardware: | None |
| Software | |
|---|---|
| Power Management: | Enabled (see SUT Notes) |
| Operating System (OS): | Microsoft Windows Server 2008, Enterprise x64 Edition |
| OS Version: | SP2, Build 6002 |
| Filesystem: | NTFS |
| JVM Vendor: | Oracle Corporation |
| JVM Version: | Oracle JRockit(R) (build P28.0.0-29-114096-1.6.0_11-20090427-1759-windows-x86_64, compiled mode) |
| JVM Command-line Options: | -Xms3200m -Xmx3200m -Xns2880m -XXaggressive -XXlargePages -XXthroughputCompaction -XXcallprofiling -XXlazyUnlocking -Xgc:genpar -XXgcthreads:4 -XXtlasize:min=12k,preferred=1024k |
| JVM Affinity: | Start /affinity [F, F0, F00, F000] |
| JVM Instances: | 4 |
| JVM Initial Heap (MB): | 3200 |
| JVM Maximum Heap (MB): | 3200 |
| JVM Address Bits: | 64 |
| Boot Firmware Version: | P59 2008.06.10 |
| Management Firmware Version: | 1.81 01/15/2010 |
| Workload Version: | SSJ 1.2.6 |
| Director Location: | Controller |
| Other Software: | None |
This benchmark result is intended to provide perspective on past power and/or performance using the historical hardware and/or software described on this result page.
The system as described on this result page was formerly generally available. At the time of this publication, it may not be shipping, and/or may not be supported, and/or may fail to meet other tests of General Availability described in the SPEC OSG Policy document, http://www.spec.org/osg/policy.html
This measured result may not be representative of the result that would be measured were this benchmark run with hardware and software available as of the publication date.
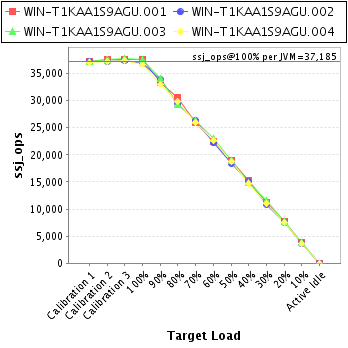
| JVM Instance | ssj_ops@100% |
|---|---|
| WIN-T1KAA1S9AGU.001 | 37,557 |
| WIN-T1KAA1S9AGU.002 | 36,919 |
| WIN-T1KAA1S9AGU.003 | 37,611 |
| WIN-T1KAA1S9AGU.004 | 36,654 |
| ssj_ops@100% | 148,741 |
| ssj_ops@100% per JVM | 37,185 |
| Target Load | Actual Load | ssj_ops | |
|---|---|---|---|
| Target | Actual | ||
| Calibration 1 | 37,182 | ||
| Calibration 2 | 37,576 | ||
| Calibration 3 | 37,667 | ||
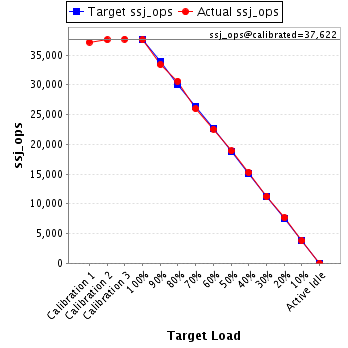
| ssj_ops@calibrated=37,622 | |||
| 100% | 99.8% | 37,622 | 37,557 |
| 90% | 88.8% | 33,860 | 33,390 |
| 80% | 81.3% | 30,097 | 30,603 |
| 70% | 69.0% | 26,335 | 25,964 |
| 60% | 59.9% | 22,573 | 22,551 |
| 50% | 50.2% | 18,811 | 18,874 |
| 40% | 40.6% | 15,049 | 15,279 |
| 30% | 29.9% | 11,287 | 11,230 |
| 20% | 20.4% | 7,524 | 7,662 |
| 10% | 10.0% | 3,762 | 3,779 |
| Active Idle | 0 | 0 | |
| Target Load | Actual Load | ssj_ops | |
|---|---|---|---|
| Target | Actual | ||
| Calibration 1 | 37,165 | ||
| Calibration 2 | 37,213 | ||
| Calibration 3 | 37,384 | ||
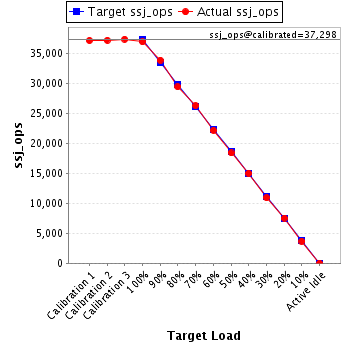
| ssj_ops@calibrated=37,298 | |||
| 100% | 99.0% | 37,298 | 36,919 |
| 90% | 90.9% | 33,568 | 33,891 |
| 80% | 78.9% | 29,839 | 29,430 |
| 70% | 70.5% | 26,109 | 26,284 |
| 60% | 59.5% | 22,379 | 22,195 |
| 50% | 49.3% | 18,649 | 18,396 |
| 40% | 40.2% | 14,919 | 14,992 |
| 30% | 29.3% | 11,189 | 10,913 |
| 20% | 20.2% | 7,460 | 7,546 |
| 10% | 9.8% | 3,730 | 3,662 |
| Active Idle | 0 | 0 | |
| Target Load | Actual Load | ssj_ops | |
|---|---|---|---|
| Target | Actual | ||
| Calibration 1 | 37,250 | ||
| Calibration 2 | 37,663 | ||
| Calibration 3 | 37,830 | ||
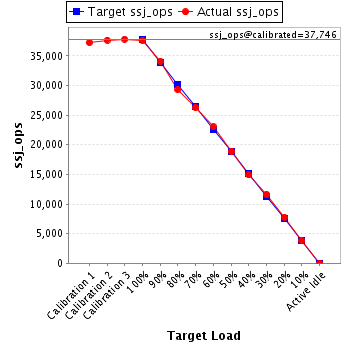
| ssj_ops@calibrated=37,746 | |||
| 100% | 99.6% | 37,746 | 37,611 |
| 90% | 90.3% | 33,972 | 34,100 |
| 80% | 77.6% | 30,197 | 29,285 |
| 70% | 69.8% | 26,422 | 26,330 |
| 60% | 61.0% | 22,648 | 23,017 |
| 50% | 50.2% | 18,873 | 18,951 |
| 40% | 39.5% | 15,099 | 14,907 |
| 30% | 30.9% | 11,324 | 11,658 |
| 20% | 20.5% | 7,549 | 7,746 |
| 10% | 10.1% | 3,775 | 3,808 |
| Active Idle | 0 | 0 | |
| Target Load | Actual Load | ssj_ops | |
|---|---|---|---|
| Target | Actual | ||
| Calibration 1 | 37,067 | ||
| Calibration 2 | 37,166 | ||
| Calibration 3 | 37,457 | ||
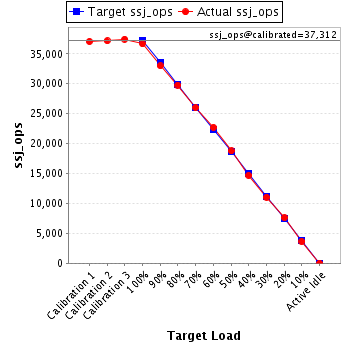
| ssj_ops@calibrated=37,312 | |||
| 100% | 98.2% | 37,312 | 36,654 |
| 90% | 88.4% | 33,580 | 32,985 |
| 80% | 79.8% | 29,849 | 29,790 |
| 70% | 69.7% | 26,118 | 25,999 |
| 60% | 60.8% | 22,387 | 22,693 |
| 50% | 50.3% | 18,656 | 18,765 |
| 40% | 39.4% | 14,925 | 14,682 |
| 30% | 29.6% | 11,193 | 11,062 |
| 20% | 20.4% | 7,462 | 7,611 |
| 10% | 9.7% | 3,731 | 3,631 |
| Active Idle | 0 | 0 | |