SPECpower_ssj2008
Host 'Peralta-4' Performance Report
Copyright © 2007-2011 Standard Performance Evaluation Corporation
| SGI Rackable C2112-4TY14 | ssj_ops@100% = 719,832 ssj_ops@100% per JVM = 119,972 |
||||
| Test Sponsor: | SGI | SPEC License #: | 4 | Test Method: | Multi Node |
| Tested By: | SGI | Test Location: | Fremont, CA, USA | Test Date: | Jan 6, 2011 |
| Hardware Availability: | Feb-2011 | Software Availability: | Dec-2010 | Publication: | Jan 26, 2011 |
| System Source: | Single Supplier | System Designation: | Server | Power Provisioning: | Line-powered |
| Target Load | Actual Load | ssj_ops | |
|---|---|---|---|
| Target | Actual | ||
| Calibration 1 | 719,653 | ||
| Calibration 2 | 721,308 | ||
| Calibration 3 | 722,409 | ||
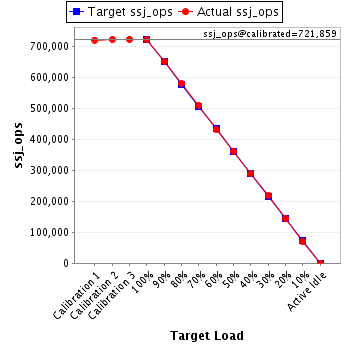
| ssj_ops@calibrated=721,859 | |||
| 100% | 99.7% | 721,859 | 719,832 |
| 90% | 90.2% | 649,673 | 651,372 |
| 80% | 80.2% | 577,487 | 579,267 |
| 70% | 70.3% | 505,301 | 507,776 |
| 60% | 59.6% | 433,115 | 430,378 |
| 50% | 50.1% | 360,929 | 361,643 |
| 40% | 40.1% | 288,744 | 289,364 |
| 30% | 30.1% | 216,558 | 217,000 |
| 20% | 20.0% | 144,372 | 144,366 |
| 10% | 9.9% | 72,186 | 71,406 |
| Active Idle | 0 | 0 | |
| Set Identifier: | sut |
| Set Description: | Rackable C2112-4TY14 |
| # of Identical Nodes: | 4 |
| Comment: | None |
| Hardware | |
|---|---|
| Hardware Vendor: | SGI |
| Model: | Rackable C2112-4TY14 |
| Form Factor: | Blade |
| CPU Name: | Intel Xeon L5640 |
| CPU Characteristics: | Six-Core, 2.27 GHz, 12 MB L3 Cache |
| CPU Frequency (MHz): | 2267 |
| CPU(s) Enabled: | 12 cores, 2 chips, 6 cores/chip |
| Hardware Threads: | 24 (2 / core) |
| CPU(s) Orderable: | 1,2 chips |
| Primary Cache: | 32 KB I + 32 KB D on chip per core |
| Secondary Cache: | 256 KB I+D on chip per core |
| Tertiary Cache: | 12 MB I+D on chip per chip |
| Other Cache: | None |
| Memory Amount (GB): | 16 |
| # and size of DIMM: | 4 x 4096 MB |
| Memory Details: | 4GB 2Rx8 PC3L-10600R; slots 1A and 2A populated for each processor |
| Power Supply Quantity and Rating (W): | None |
| Power Supply Details: | Shared |
| Disk Drive: | 1 x 60 GB SATA SSD, SGI Part #SGICSTE025M31-0060 |
| Disk Controller: | Intel ESB2 based Integrated SATA controller |
| # and type of Network Interface Cards (NICs) Installed: | 2 x Integrated Intel 82574L Gigabit Ethernet |
| NICs Enabled in Firmware / OS / Connected: | 2/2/1 |
| Network Speed (Mbit): | 1000 |
| Keyboard: | None |
| Mouse: | None |
| Monitor: | None |
| Optical Drives: | No |
| Other Hardware: | None |
| Software | |
|---|---|
| Power Management: | power saver enabled in OS |
| Operating System (OS): | Microsoft Windows Server 2008 R2 Enterprise Edition |
| OS Version: | 64bit |
| Filesystem: | NTFS |
| JVM Vendor: | IBM Corporation |
| JVM Version: | IBM J9 VM (build 2.4, JRE 1.6.0 IBM J9 2.4 Windows Server 2008 amd64-64 jvmwa6460sr7-20091214_49398 (JIT enabled, AOT enabled) |
| JVM Command-line Options: | -Xmn1600m -Xms2000m -Xmx2000m -Xaggressive -Xcompressedrefs -Xgcpolicy:gencon -XlockReservation -Xnoloa -XtlhPrefetch -Xlp |
| JVM Affinity: | start /AFFINITY [F F0 F00 F000 F0000 F00000] |
| JVM Instances: | 6 |
| JVM Initial Heap (MB): | 2000 |
| JVM Maximum Heap (MB): | 2000 |
| JVM Address Bits: | 64 |
| Boot Firmware Version: | 2.0c.b01 |
| Management Firmware Version: | None |
| Workload Version: | SSJ 1.2.6 |
| Director Location: | Controller |
| Other Software: | IBM Websphere Application Server Community Edition V2.1.1.4 for windows on X86-64bit |
| JVM Instance | ssj_ops@100% |
|---|---|
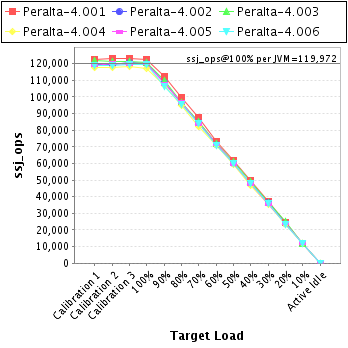
| Peralta-4.001 | 122,337 |
| Peralta-4.002 | 119,980 |
| Peralta-4.003 | 120,591 |
| Peralta-4.004 | 117,356 |
| Peralta-4.005 | 120,228 |
| Peralta-4.006 | 119,340 |
| ssj_ops@100% | 719,832 |
| ssj_ops@100% per JVM | 119,972 |
| Target Load | Actual Load | ssj_ops | |
|---|---|---|---|
| Target | Actual | ||
| Calibration 1 | 122,665 | ||
| Calibration 2 | 123,289 | ||
| Calibration 3 | 122,987 | ||
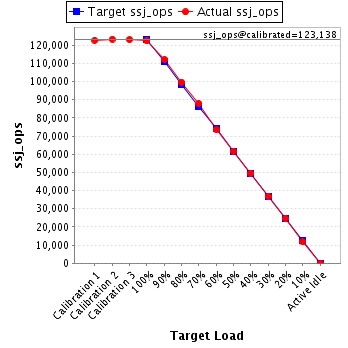
| ssj_ops@calibrated=123,138 | |||
| 100% | 99.3% | 123,138 | 122,337 |
| 90% | 91.0% | 110,824 | 112,050 |
| 80% | 81.0% | 98,510 | 99,712 |
| 70% | 71.4% | 86,196 | 87,921 |
| 60% | 59.6% | 73,883 | 73,424 |
| 50% | 50.1% | 61,569 | 61,729 |
| 40% | 40.3% | 49,255 | 49,622 |
| 30% | 30.0% | 36,941 | 36,997 |
| 20% | 20.1% | 24,628 | 24,700 |
| 10% | 9.6% | 12,314 | 11,792 |
| Active Idle | 0 | 0 | |
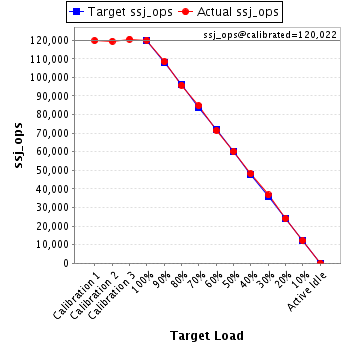
| Target Load | Actual Load | ssj_ops | |
|---|---|---|---|
| Target | Actual | ||
| Calibration 1 | 119,777 | ||
| Calibration 2 | 119,466 | ||
| Calibration 3 | 120,579 | ||
| ssj_ops@calibrated=120,022 | |||
| 100% | 100.0% | 120,022 | 119,980 |
| 90% | 90.3% | 108,020 | 108,400 |
| 80% | 79.8% | 96,018 | 95,775 |
| 70% | 70.6% | 84,016 | 84,768 |
| 60% | 59.5% | 72,013 | 71,411 |
| 50% | 50.1% | 60,011 | 60,182 |
| 40% | 40.1% | 48,009 | 48,125 |
| 30% | 30.6% | 36,007 | 36,740 |
| 20% | 20.1% | 24,004 | 24,068 |
| 10% | 10.1% | 12,002 | 12,150 |
| Active Idle | 0 | 0 | |
| Target Load | Actual Load | ssj_ops | |
|---|---|---|---|
| Target | Actual | ||
| Calibration 1 | 121,755 | ||
| Calibration 2 | 121,518 | ||
| Calibration 3 | 121,413 | ||
| ssj_ops@calibrated=121,465 | |||
| 100% | 99.3% | 121,465 | 120,591 |
| 90% | 90.3% | 109,319 | 109,658 |
| 80% | 79.7% | 97,172 | 96,800 |
| 70% | 70.1% | 85,026 | 85,171 |
| 60% | 59.0% | 72,879 | 71,709 |
| 50% | 50.2% | 60,733 | 60,930 |
| 40% | 40.3% | 48,586 | 48,952 |
| 30% | 29.8% | 36,440 | 36,237 |
| 20% | 20.5% | 24,293 | 24,840 |
| 10% | 9.7% | 12,147 | 11,779 |
| Active Idle | 0 | 0 | |

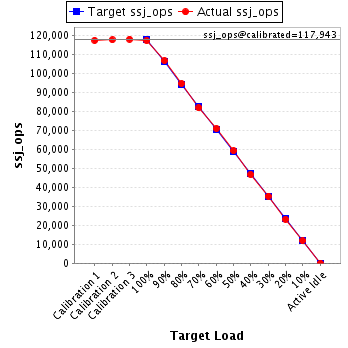
| Target Load | Actual Load | ssj_ops | |
|---|---|---|---|
| Target | Actual | ||
| Calibration 1 | 117,481 | ||
| Calibration 2 | 117,757 | ||
| Calibration 3 | 118,129 | ||
| ssj_ops@calibrated=117,943 | |||
| 100% | 99.5% | 117,943 | 117,356 |
| 90% | 90.6% | 106,149 | 106,815 |
| 80% | 80.4% | 94,354 | 94,770 |
| 70% | 69.5% | 82,560 | 81,933 |
| 60% | 60.2% | 70,766 | 71,022 |
| 50% | 50.3% | 58,971 | 59,281 |
| 40% | 39.6% | 47,177 | 46,730 |
| 30% | 30.0% | 35,383 | 35,420 |
| 20% | 19.7% | 23,589 | 23,192 |
| 10% | 10.1% | 11,794 | 11,886 |
| Active Idle | 0 | 0 | |
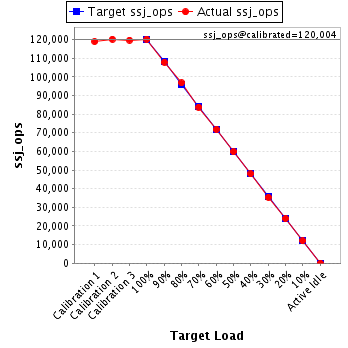
| Target Load | Actual Load | ssj_ops | |
|---|---|---|---|
| Target | Actual | ||
| Calibration 1 | 118,987 | ||
| Calibration 2 | 120,231 | ||
| Calibration 3 | 119,778 | ||
| ssj_ops@calibrated=120,004 | |||
| 100% | 100.2% | 120,004 | 120,228 |
| 90% | 89.9% | 108,004 | 107,926 |
| 80% | 80.6% | 96,003 | 96,726 |
| 70% | 69.8% | 84,003 | 83,815 |
| 60% | 59.9% | 72,003 | 71,882 |
| 50% | 49.8% | 60,002 | 59,819 |
| 40% | 39.9% | 48,002 | 47,908 |
| 30% | 29.5% | 36,001 | 35,415 |
| 20% | 20.0% | 24,001 | 23,994 |
| 10% | 10.0% | 12,000 | 12,012 |
| Active Idle | 0 | 0 | |
| Target Load | Actual Load | ssj_ops | |
|---|---|---|---|
| Target | Actual | ||
| Calibration 1 | 118,987 | ||
| Calibration 2 | 119,048 | ||
| Calibration 3 | 119,524 | ||
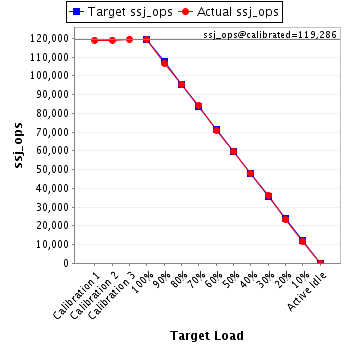
| ssj_ops@calibrated=119,286 | |||
| 100% | 100.0% | 119,286 | 119,340 |
| 90% | 89.3% | 107,357 | 106,523 |
| 80% | 80.0% | 95,429 | 95,483 |
| 70% | 70.6% | 83,500 | 84,167 |
| 60% | 59.5% | 71,572 | 70,929 |
| 50% | 50.0% | 59,643 | 59,702 |
| 40% | 40.3% | 47,714 | 48,027 |
| 30% | 30.3% | 35,786 | 36,191 |
| 20% | 19.8% | 23,857 | 23,573 |
| 10% | 9.9% | 11,929 | 11,787 |
| Active Idle | 0 | 0 | |