SPECpower_ssj2008
Aggregate Performance Report
Copyright © 2007-2010 Standard Performance Evaluation Corporation
| Hewlett-Packard Company ProLiant DL170e G6 | ssj_ops@100% = 2,886,872 ssj_ops@100% per Host = 721,718 ssj_ops@100% per JVM = 120,286 |
||||
| Test Sponsor: | Hewlett-Packard Company | SPEC License #: | 3 | Test Method: | Multi Node |
| Tested By: | Hewlett-Packard Company | Test Location: | Houston, TX, USA | Test Date: | Nov 13, 2010 |
| Hardware Availability: | Nov-2010 | Software Availability: | Sep-2009 | Publication: | Dec 1, 2010 |
| System Source: | Single Supplier | System Designation: | Server | Power Provisioning: | Line-powered |
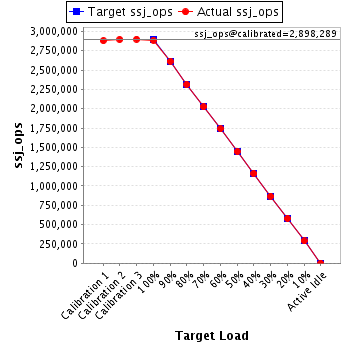
| Target Load | Actual Load | ssj_ops | |
|---|---|---|---|
| Target | Actual | ||
| Calibration 1 | 2,879,266 | ||
| Calibration 2 | 2,896,460 | ||
| Calibration 3 | 2,900,118 | ||
| ssj_ops@calibrated=2,898,289 | |||
| 100% | 99.6% | 2,898,289 | 2,886,872 |
| 90% | 90.2% | 2,608,460 | 2,613,978 |
| 80% | 79.8% | 2,318,631 | 2,313,793 |
| 70% | 69.9% | 2,028,802 | 2,024,472 |
| 60% | 60.0% | 1,738,973 | 1,739,126 |
| 50% | 49.9% | 1,449,144 | 1,446,103 |
| 40% | 40.0% | 1,159,316 | 1,159,824 |
| 30% | 30.0% | 869,487 | 868,136 |
| 20% | 20.0% | 579,658 | 578,942 |
| 10% | 10.0% | 289,829 | 288,389 |
| Active Idle | 0 | 0 | |
| # of Nodes | # of Chips | # of Cores | # of Threads | Total RAM (GB) | # of OS Images | # of JVM Instances |
|---|---|---|---|---|---|---|
| 4 | 8 | 48 | 96 | 64.0 | 4 | 24 |
| Set Identifier: | sut |
| Set Description: | ProLiant DL170e G6 |
| # of Identical Nodes: | 4 |
| Comment: | None |
| Hardware per Node | |
|---|---|
| Hardware Vendor: | Hewlett-Packard Company |
| Model: | ProLiant DL170e G6 |
| Form Factor: | 2U |
| CPU Name: | Intel Xeon L5640 |
| CPU Characteristics: | Six-Core, 2.27 GHz, 12 MB L3 Cache |
| CPU Frequency (MHz): | 2267 |
| CPU(s) Enabled: | 12 cores, 2 chips, 6 cores/chip |
| Hardware Threads: | 24 (2 / core) |
| CPU(s) Orderable: | 1,2 chips |
| Primary Cache: | 32 KB I + 32 KB D on chip per core |
| Secondary Cache: | 256 KB I+D on chip per core |
| Tertiary Cache: | 12 MB I+D on chip per chip |
| Other Cache: | None |
| Memory Amount (GB): | 16 |
| # and size of DIMM: | 4 x 4096 MB |
| Memory Details: | 4GB 2Rx8 PC3L-10600E ECC CL5; slots 1, 5, populated per proc |
| Power Supply Quantity and Rating (W): | None |
| Power Supply Details: | Shared |
| Disk Drive: | 1 x 120 GB SATA SSD, HP Part #539557-010 |
| Disk Controller: | Integrated SATA controller |
| # and type of Network Interface Cards (NICs) Installed: | 1 x HP NC362i Integrated Dual Port Gigabit Server Adapter |
| NICs Enabled in Firmware / OS / Connected: | 1/1/1 |
| Network Speed (Mbit): | 1000 |
| Keyboard: | None |
| Mouse: | None |
| Monitor: | None |
| Optical Drives: | No |
| Other Hardware: | None |
| Software per Node | |
|---|---|
| Power Management: | Power saver enabled in OS |
| Operating System (OS): | Windows Server 2008, Enterprise Edition |
| OS Version: | R2 |
| Filesystem: | NTFS |
| JVM Vendor: | IBM Corporation |
| JVM Version: | IBM J9 VM (build 2.4, J2RE 1.6.0 IBM J9 2.4 Windows Server 2008 amd64-64 jvmwa660sr5-20090519_35743 (JIT enabled, AOT enabled) |
| JVM Command-line Options: | -Xaggressive -Xcompressedrefs -Xgcpolicy:gencon -Xmn1600m -Xms2000m -Xmx2000m -XlockReservation -Xnoloa -XtlhPrefetch -Xlp |
| JVM Affinity: | start /affinity [F,F0,F00,F000,F0000,F00000] |
| JVM Instances: | 6 |
| JVM Initial Heap (MB): | 2000 |
| JVM Maximum Heap (MB): | 2000 |
| JVM Address Bits: | 64 |
| Boot Firmware Version: | 034 10/25/10 |
| Management Firmware Version: | 4.21 7/16/10 |
| Workload Version: | SSJ 1.2.6 |
| Director Location: | Controller |
| Other Software: | IBM Websphere Application Server |
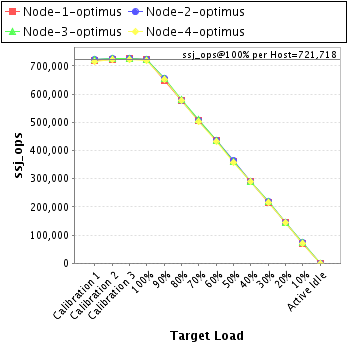
| Host | ssj_ops@100% |
|---|---|
| Node-1-optimus | 721,253 |
| Node-2-optimus | 724,297 |
| Node-3-optimus | 722,617 |
| Node-4-optimus | 718,704 |
| ssj_ops@100% | 2,886,872 |
| ssj_ops@100% per Host | 721,718 |
| ssj_ops@100% per JVM | 120,286 |
| Target Load | Actual Load | ssj_ops | |
|---|---|---|---|
| Target | Actual | ||
| Calibration 1 | 718,592 | ||
| Calibration 2 | 723,364 | ||
| Calibration 3 | 724,480 | ||
| ssj_ops@calibrated=723,922 | |||
| 100% | 99.6% | 723,922 | 721,253 |
| 90% | 89.7% | 651,530 | 649,625 |
| 80% | 79.7% | 579,137 | 576,938 |
| 70% | 69.9% | 506,745 | 506,202 |
| 60% | 60.1% | 434,353 | 435,383 |
| 50% | 49.9% | 361,961 | 361,548 |
| 40% | 40.1% | 289,569 | 290,545 |
| 30% | 29.9% | 217,177 | 216,643 |
| 20% | 19.9% | 144,784 | 144,319 |
| 10% | 9.9% | 72,392 | 71,680 |
| Active Idle | 0 | 0 | |
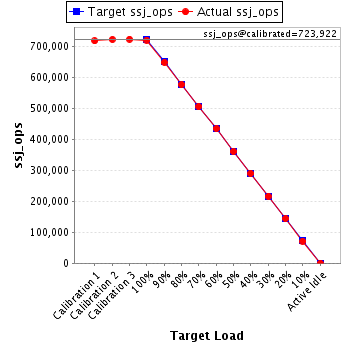
| Target Load | Actual Load | ssj_ops | |
|---|---|---|---|
| Target | Actual | ||
| Calibration 1 | 723,118 | ||
| Calibration 2 | 725,881 | ||
| Calibration 3 | 727,250 | ||
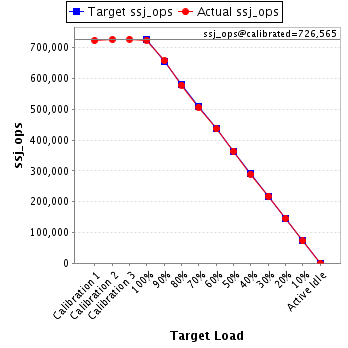
| ssj_ops@calibrated=726,565 | |||
| 100% | 99.7% | 726,565 | 724,297 |
| 90% | 90.4% | 653,909 | 656,910 |
| 80% | 79.6% | 581,252 | 578,490 |
| 70% | 69.8% | 508,596 | 506,806 |
| 60% | 60.0% | 435,939 | 436,110 |
| 50% | 50.1% | 363,283 | 364,175 |
| 40% | 39.8% | 290,626 | 289,410 |
| 30% | 30.0% | 217,970 | 217,628 |
| 20% | 20.0% | 145,313 | 145,128 |
| 10% | 9.9% | 72,657 | 72,269 |
| Active Idle | 0 | 0 | |
| Target Load | Actual Load | ssj_ops | |
|---|---|---|---|
| Target | Actual | ||
| Calibration 1 | 721,892 | ||
| Calibration 2 | 725,568 | ||
| Calibration 3 | 726,621 | ||
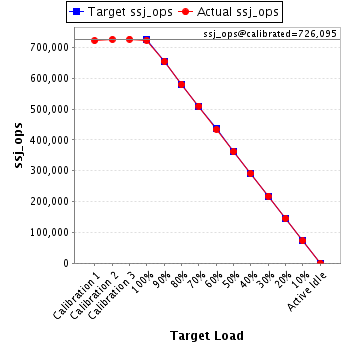
| ssj_ops@calibrated=726,095 | |||
| 100% | 99.5% | 726,095 | 722,617 |
| 90% | 90.1% | 653,485 | 654,162 |
| 80% | 79.8% | 580,876 | 579,495 |
| 70% | 70.2% | 508,266 | 509,909 |
| 60% | 59.8% | 435,657 | 434,097 |
| 50% | 49.8% | 363,047 | 361,768 |
| 40% | 40.1% | 290,438 | 291,179 |
| 30% | 30.0% | 217,828 | 217,671 |
| 20% | 20.0% | 145,219 | 145,459 |
| 10% | 10.0% | 72,609 | 72,639 |
| Active Idle | 0 | 0 | |
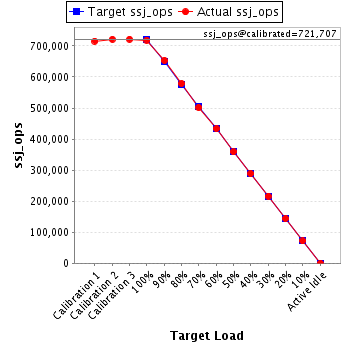
| Target Load | Actual Load | ssj_ops | |
|---|---|---|---|
| Target | Actual | ||
| Calibration 1 | 715,665 | ||
| Calibration 2 | 721,647 | ||
| Calibration 3 | 721,767 | ||
| ssj_ops@calibrated=721,707 | |||
| 100% | 99.6% | 721,707 | 718,704 |
| 90% | 90.5% | 649,537 | 653,281 |
| 80% | 80.2% | 577,366 | 578,871 |
| 70% | 69.5% | 505,195 | 501,554 |
| 60% | 60.1% | 433,024 | 433,537 |
| 50% | 49.7% | 360,854 | 358,612 |
| 40% | 40.0% | 288,683 | 288,690 |
| 30% | 30.0% | 216,512 | 216,194 |
| 20% | 20.0% | 144,341 | 144,036 |
| 10% | 9.9% | 72,171 | 71,801 |
| Active Idle | 0 | 0 | |