SPECpower_ssj2008
Host 'WIN-G3PA67VU49T' Performance Report
Copyright © 2007-2010 Standard Performance Evaluation Corporation
| Fujitsu PRIMERGY TX150 S7 (Intel Xeon X3480) | ssj_ops@100% = 330,353 ssj_ops@100% per JVM = 165,176 |
||||
| Test Sponsor: | Fujitsu | SPEC License #: | 19 | Test Method: | Single Node |
| Tested By: | Fujitsu | Test Location: | Paderborn, NRW, Germany | Test Date: | Oct 20, 2010 |
| Hardware Availability: | Jun-2010 | Software Availability: | Nov-2009 | Publication: | Dec 1, 2010 |
| System Source: | Single Supplier | System Designation: | Server | Power Provisioning: | Line-powered |
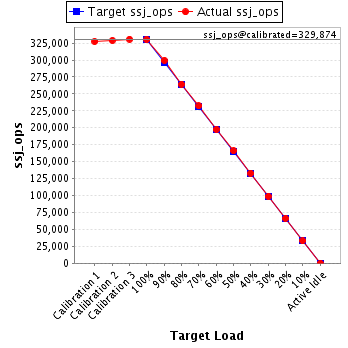
| Target Load | Actual Load | ssj_ops | |
|---|---|---|---|
| Target | Actual | ||
| Calibration 1 | 327,462 | ||
| Calibration 2 | 328,894 | ||
| Calibration 3 | 330,854 | ||
| ssj_ops@calibrated=329,874 | |||
| 100% | 100.1% | 329,874 | 330,353 |
| 90% | 90.8% | 296,886 | 299,373 |
| 80% | 80.2% | 263,899 | 264,454 |
| 70% | 70.4% | 230,912 | 232,261 |
| 60% | 59.9% | 197,924 | 197,591 |
| 50% | 50.3% | 164,937 | 166,009 |
| 40% | 40.3% | 131,949 | 133,067 |
| 30% | 30.0% | 98,962 | 98,925 |
| 20% | 20.1% | 65,975 | 66,426 |
| 10% | 10.0% | 32,987 | 32,964 |
| Active Idle | 0 | 0 | |
| Set Identifier: | SUT |
| Set Description: | System Under Test |
| # of Identical Nodes: | 1 |
| Comment: | None |
| Hardware | |
|---|---|
| Hardware Vendor: | Fujitsu |
| Model: | PRIMERGY TX150 S7 (Intel Xeon X3480) |
| Form Factor: | Tower |
| CPU Name: | Intel Xeon X3480 |
| CPU Characteristics: | Quad-Core, 3.06GHz, 8MB L3 Cache |
| CPU Frequency (MHz): | 3067 |
| CPU(s) Enabled: | 4 cores, 1 chip, 4 cores/chip |
| Hardware Threads: | 8 (2 / core) |
| CPU(s) Orderable: | 1 chip |
| Primary Cache: | 32 KB I + 32 KB D on chip per core |
| Secondary Cache: | 256 KB I+D on chip per core |
| Tertiary Cache: | 8 MB I+D on chip per chip |
| Other Cache: | None |
| Memory Amount (GB): | 4 |
| # and size of DIMM: | 2 x 2048 MB |
| Memory Details: | 2GB 2Rx8 PC3-10600E ECC CL9; slots 1A, 1B populated |
| Power Supply Quantity and Rating (W): | 1 x 350 |
| Power Supply Details: | Fujitsu Technology Solutions S26113-E549-V50-01 |
| Disk Drive: | 1 x 32GB SSD 2.5" SATA (Fujitsu S26361-F3298-E32) |
| Disk Controller: | Integrated SATA Controller |
| # and type of Network Interface Cards (NICs) Installed: | 1 x Intel 82574L Gigabit Network Connection (onboard) |
| NICs Enabled in Firmware / OS / Connected: | 1/1/1 |
| Network Speed (Mbit): | 1000 |
| Keyboard: | None |
| Mouse: | None |
| Monitor: | None |
| Optical Drives: | No |
| Other Hardware: | None |
| Software | |
|---|---|
| Power Management: | Enabled ("Fujitsu Enhanced Power Settings" power plan) |
| Operating System (OS): | Microsoft Windows Server 2008 R2 Enterprise |
| OS Version: | Version 6.1.7600 Build 7600 |
| Filesystem: | NTFS |
| JVM Vendor: | IBM Corporation |
| JVM Version: | IBM J9 VM (build 2.4, JRE 1.6.0 IBM J9 2.4 Windows Server 2008 amd64-64 jvmwa6460sr6-20090923_42924 (JIT enabled, AOT enabled) |
| JVM Command-line Options: | -Xaggressive -Xcompressedrefs -Xgcpolicy:gencon -Xmn1000m -Xms1350m -Xmx1350m -XlockReservation -Xnoloa -XtlhPrefetch -Xlp |
| JVM Affinity: | start /affinity [0x0F,0xF0] |
| JVM Instances: | 2 |
| JVM Initial Heap (MB): | 1350 |
| JVM Maximum Heap (MB): | 1350 |
| JVM Address Bits: | 64 |
| Boot Firmware Version: | 1.07 |
| Management Firmware Version: | 5.08A |
| Workload Version: | SSJ 1.2.6 |
| Director Location: | Controller |
| Other Software: | IBM Websphere application server V7.0 for Windows on X86-64bit |
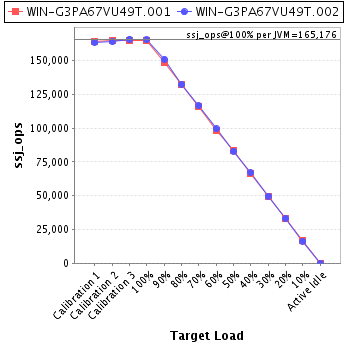
| JVM Instance | ssj_ops@100% |
|---|---|
| WIN-G3PA67VU49T.001 | 164,985 |
| WIN-G3PA67VU49T.002 | 165,368 |
| ssj_ops@100% | 330,353 |
| ssj_ops@100% per JVM | 165,176 |
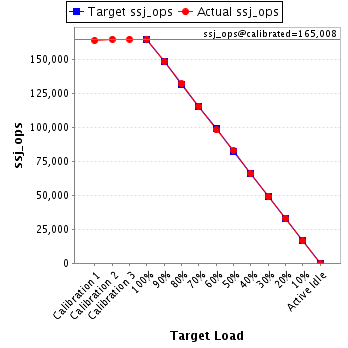
| Target Load | Actual Load | ssj_ops | |
|---|---|---|---|
| Target | Actual | ||
| Calibration 1 | 164,042 | ||
| Calibration 2 | 164,949 | ||
| Calibration 3 | 165,067 | ||
| ssj_ops@calibrated=165,008 | |||
| 100% | 100.0% | 165,008 | 164,985 |
| 90% | 90.0% | 148,507 | 148,554 |
| 80% | 80.1% | 132,007 | 132,110 |
| 70% | 70.1% | 115,506 | 115,726 |
| 60% | 59.5% | 99,005 | 98,172 |
| 50% | 50.3% | 82,504 | 83,065 |
| 40% | 40.0% | 66,003 | 66,074 |
| 30% | 29.9% | 49,502 | 49,346 |
| 20% | 20.1% | 33,002 | 33,204 |
| 10% | 10.0% | 16,501 | 16,529 |
| Active Idle | 0 | 0 | |
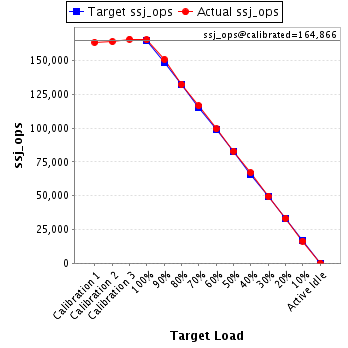
| Target Load | Actual Load | ssj_ops | |
|---|---|---|---|
| Target | Actual | ||
| Calibration 1 | 163,421 | ||
| Calibration 2 | 163,945 | ||
| Calibration 3 | 165,786 | ||
| ssj_ops@calibrated=164,866 | |||
| 100% | 100.3% | 164,866 | 165,368 |
| 90% | 91.5% | 148,379 | 150,820 |
| 80% | 80.3% | 131,892 | 132,344 |
| 70% | 70.7% | 115,406 | 116,535 |
| 60% | 60.3% | 98,919 | 99,419 |
| 50% | 50.3% | 82,433 | 82,944 |
| 40% | 40.6% | 65,946 | 66,993 |
| 30% | 30.1% | 49,460 | 49,579 |
| 20% | 20.2% | 32,973 | 33,222 |
| 10% | 10.0% | 16,487 | 16,435 |
| Active Idle | 0 | 0 | |