SPECpower_ssj2008
Host 'WIN-NC6UT8SII0O' Performance Report
Copyright © 2007-2010 Standard Performance Evaluation Corporation
| Acer Incorporated Gateway GR180 F1(Intel Xeon X5670, 2.93 GHz) | ssj_ops@100% = 896,101 ssj_ops@100% per JVM = 149,350 |
||||
| Test Sponsor: | Acer Incorporated | SPEC License #: | 97 | Test Method: | Single Node |
| Tested By: | Acer Incorporated | Test Location: | Taipei, R.O.C. | Test Date: | Nov 2, 2010 |
| Hardware Availability: | Jun-2010 | Software Availability: | Dec-2009 | Publication: | Dec 1, 2010 |
| System Source: | Single Supplier | System Designation: | Server | Power Provisioning: | Line-powered |
| Target Load | Actual Load | ssj_ops | |
|---|---|---|---|
| Target | Actual | ||
| Calibration 1 | 895,748 | ||
| Calibration 2 | 898,958 | ||
| Calibration 3 | 901,191 | ||
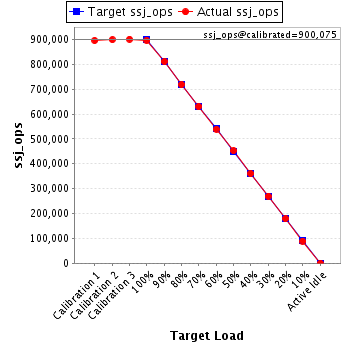
| ssj_ops@calibrated=900,075 | |||
| 100% | 99.6% | 900,075 | 896,101 |
| 90% | 90.2% | 810,067 | 811,462 |
| 80% | 79.8% | 720,060 | 718,345 |
| 70% | 70.0% | 630,052 | 630,102 |
| 60% | 60.0% | 540,045 | 539,652 |
| 50% | 50.3% | 450,037 | 452,312 |
| 40% | 40.1% | 360,030 | 360,508 |
| 30% | 30.0% | 270,022 | 270,226 |
| 20% | 19.9% | 180,015 | 178,954 |
| 10% | 9.9% | 90,007 | 89,523 |
| Active Idle | 0 | 0 | |
| Set Identifier: | sut |
| Set Description: | System Under Test |
| # of Identical Nodes: | 1 |
| Comment: | None |
| Hardware | |
|---|---|
| Hardware Vendor: | Acer Incorporated |
| Model: | Gateway GR180 F1(Intel Xeon X5670, 2.93 GHz) |
| Form Factor: | 2U |
| CPU Name: | Intel Xeon X5670 |
| CPU Characteristics: | Six-Core, 2.93 GHz, 12 MB L3 cache |
| CPU Frequency (MHz): | 2933 |
| CPU(s) Enabled: | 12 cores, 2 chips, 6 cores/chip |
| Hardware Threads: | 24 (2 / core) |
| CPU(s) Orderable: | 1,2 chips |
| Primary Cache: | 32 KB I + 32 KB D on chip per core |
| Secondary Cache: | 512 KB I+D on chip per core |
| Tertiary Cache: | 12 MB I+D on chip per chip |
| Other Cache: | None |
| Memory Amount (GB): | 12 |
| # and size of DIMM: | 6 x 2048 MB |
| Memory Details: | 2GB 2Rx8 PC3-10600E; slots 1A, 2A, and 3A populated on each processor |
| Power Supply Quantity and Rating (W): | 1 x 720 |
| Power Supply Details: | PWS-721P-1R |
| Disk Drive: | 1 x 64GB SSD 2.5" SATA(Intel SSDSA2SH064G1GC #899386) |
| Disk Controller: | onboard SATA controller |
| # and type of Network Interface Cards (NICs) Installed: | 1 x Dual-port Intel 82576EB Gigabit Ethernet controller |
| NICs Enabled in Firmware / OS / Connected: | 2/2/1 |
| Network Speed (Mbit): | 1000 |
| Keyboard: | PS2 |
| Mouse: | PS2 |
| Monitor: | Direct |
| Optical Drives: | No |
| Other Hardware: | None |
| Software | |
|---|---|
| Power Management: | Power save enabled in OS |
| Operating System (OS): | Windows Server 2008, Enterprise Edition |
| OS Version: | R2 |
| Filesystem: | NTFS |
| JVM Vendor: | IBM Corporation |
| JVM Version: | IBM J9 VM (build 2.4, JRE 1.6.0 IBM J9 2.4 Windows Server 2008 amd64-64 jvmwa6460sr7-20091214_49398 (JIT enabled, AOT enabled) |
| JVM Command-line Options: | -Xmn1100m -Xms1500m -Xmx1500m -Xaggressive -Xcompressedrefs -Xgcpolicy:gencon -XlockReservation -Xnoloa -XtlhPrefetch -Xlp |
| JVM Affinity: | start /affinity [0xF, 0xF0, 0xF00,0xF000, 0xF0000, 0xF00000] |
| JVM Instances: | 6 |
| JVM Initial Heap (MB): | 1500 |
| JVM Maximum Heap (MB): | 1500 |
| JVM Address Bits: | 64 |
| Boot Firmware Version: | P05 |
| Management Firmware Version: | 1.01 |
| Workload Version: | SSJ 1.2.6 |
| Director Location: | Controller |
| Other Software: | IBM Websphere Application Server V7.0 for Windows on x86-64bit |
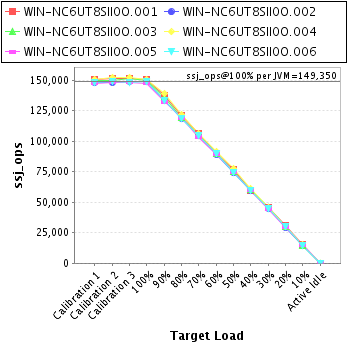
| JVM Instance | ssj_ops@100% |
|---|---|
| WIN-NC6UT8SII0O.001 | 150,890 |
| WIN-NC6UT8SII0O.002 | 149,052 |
| WIN-NC6UT8SII0O.003 | 149,417 |
| WIN-NC6UT8SII0O.004 | 150,752 |
| WIN-NC6UT8SII0O.005 | 147,337 |
| WIN-NC6UT8SII0O.006 | 148,653 |
| ssj_ops@100% | 896,101 |
| ssj_ops@100% per JVM | 149,350 |
| Target Load | Actual Load | ssj_ops | |
|---|---|---|---|
| Target | Actual | ||
| Calibration 1 | 150,599 | ||
| Calibration 2 | 151,231 | ||
| Calibration 3 | 151,661 | ||
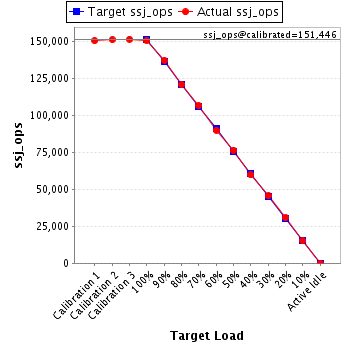
| ssj_ops@calibrated=151,446 | |||
| 100% | 99.6% | 151,446 | 150,890 |
| 90% | 90.6% | 136,301 | 137,226 |
| 80% | 79.8% | 121,157 | 120,844 |
| 70% | 70.5% | 106,012 | 106,753 |
| 60% | 59.4% | 90,867 | 90,023 |
| 50% | 50.6% | 75,723 | 76,605 |
| 40% | 39.4% | 60,578 | 59,744 |
| 30% | 30.1% | 45,434 | 45,556 |
| 20% | 20.3% | 30,289 | 30,704 |
| 10% | 10.0% | 15,145 | 15,092 |
| Active Idle | 0 | 0 | |
| Target Load | Actual Load | ssj_ops | |
|---|---|---|---|
| Target | Actual | ||
| Calibration 1 | 148,121 | ||
| Calibration 2 | 148,110 | ||
| Calibration 3 | 149,154 | ||
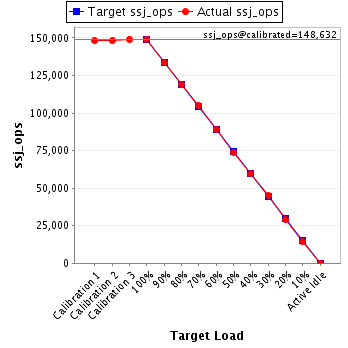
| ssj_ops@calibrated=148,632 | |||
| 100% | 100.3% | 148,632 | 149,052 |
| 90% | 89.8% | 133,769 | 133,490 |
| 80% | 79.9% | 118,906 | 118,718 |
| 70% | 70.5% | 104,042 | 104,735 |
| 60% | 60.0% | 89,179 | 89,167 |
| 50% | 49.8% | 74,316 | 73,986 |
| 40% | 40.1% | 59,453 | 59,585 |
| 30% | 30.3% | 44,590 | 45,027 |
| 20% | 19.6% | 29,726 | 29,203 |
| 10% | 9.9% | 14,863 | 14,656 |
| Active Idle | 0 | 0 | |
| Target Load | Actual Load | ssj_ops | |
|---|---|---|---|
| Target | Actual | ||
| Calibration 1 | 150,016 | ||
| Calibration 2 | 150,022 | ||
| Calibration 3 | 151,170 | ||
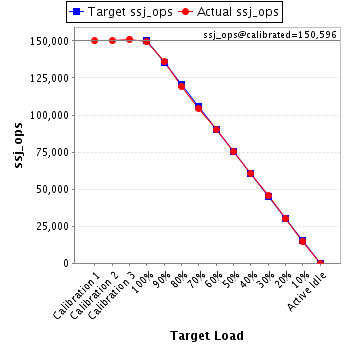
| ssj_ops@calibrated=150,596 | |||
| 100% | 99.2% | 150,596 | 149,417 |
| 90% | 90.3% | 135,536 | 136,053 |
| 80% | 79.4% | 120,477 | 119,524 |
| 70% | 69.4% | 105,417 | 104,451 |
| 60% | 59.8% | 90,357 | 89,990 |
| 50% | 49.9% | 75,298 | 75,182 |
| 40% | 40.0% | 60,238 | 60,306 |
| 30% | 30.1% | 45,179 | 45,402 |
| 20% | 19.8% | 30,119 | 29,870 |
| 10% | 9.9% | 15,060 | 14,965 |
| Active Idle | 0 | 0 | |
| Target Load | Actual Load | ssj_ops | |
|---|---|---|---|
| Target | Actual | ||
| Calibration 1 | 150,898 | ||
| Calibration 2 | 152,144 | ||
| Calibration 3 | 152,505 | ||
| ssj_ops@calibrated=152,325 | |||
| 100% | 99.0% | 152,325 | 150,752 |
| 90% | 91.3% | 137,092 | 138,999 |
| 80% | 79.8% | 121,860 | 121,550 |
| 70% | 69.7% | 106,627 | 106,216 |
| 60% | 59.9% | 91,395 | 91,246 |
| 50% | 50.8% | 76,162 | 77,447 |
| 40% | 40.0% | 60,930 | 60,997 |
| 30% | 29.8% | 45,697 | 45,330 |
| 20% | 19.6% | 30,465 | 29,867 |
| 10% | 10.1% | 15,232 | 15,338 |
| Active Idle | 0 | 0 | |

| Target Load | Actual Load | ssj_ops | |
|---|---|---|---|
| Target | Actual | ||
| Calibration 1 | 147,733 | ||
| Calibration 2 | 148,555 | ||
| Calibration 3 | 148,304 | ||
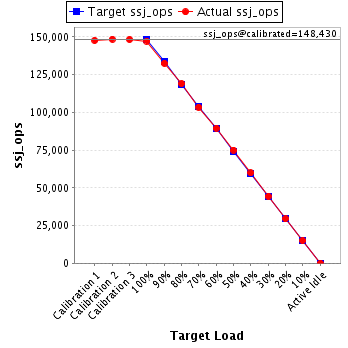
| ssj_ops@calibrated=148,430 | |||
| 100% | 99.3% | 148,430 | 147,337 |
| 90% | 89.3% | 133,587 | 132,567 |
| 80% | 80.2% | 118,744 | 119,090 |
| 70% | 69.7% | 103,901 | 103,466 |
| 60% | 60.3% | 89,058 | 89,551 |
| 50% | 50.6% | 74,215 | 75,079 |
| 40% | 40.3% | 59,372 | 59,845 |
| 30% | 29.9% | 44,529 | 44,423 |
| 20% | 19.8% | 29,686 | 29,437 |
| 10% | 10.1% | 14,843 | 15,061 |
| Active Idle | 0 | 0 | |
| Target Load | Actual Load | ssj_ops | |
|---|---|---|---|
| Target | Actual | ||
| Calibration 1 | 148,381 | ||
| Calibration 2 | 148,897 | ||
| Calibration 3 | 148,397 | ||
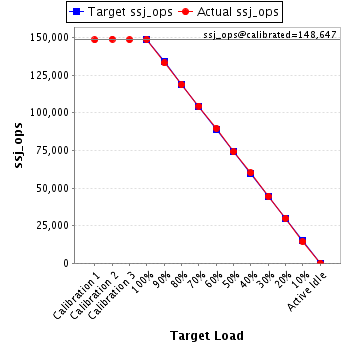
| ssj_ops@calibrated=148,647 | |||
| 100% | 100.0% | 148,647 | 148,653 |
| 90% | 89.6% | 133,782 | 133,126 |
| 80% | 79.8% | 118,917 | 118,619 |
| 70% | 70.3% | 104,053 | 104,479 |
| 60% | 60.3% | 89,188 | 89,675 |
| 50% | 49.8% | 74,323 | 74,014 |
| 40% | 40.4% | 59,459 | 60,031 |
| 30% | 29.9% | 44,594 | 44,486 |
| 20% | 20.1% | 29,729 | 29,873 |
| 10% | 9.7% | 14,865 | 14,412 |
| Active Idle | 0 | 0 | |