SPECpower_ssj2008
Host 'WIN-1UVE8JICLK2' Performance Report
Copyright © 2007-2010 Standard Performance Evaluation Corporation
| Acer Incorporated Acer AT150 F1(Intel Xeon X5670, 2.93 GHz) | ssj_ops@100% = 901,396 ssj_ops@100% per JVM = 150,233 |
||||
| Test Sponsor: | Acer Incorporated | SPEC License #: | 97 | Test Method: | Single Node |
| Tested By: | Acer Incorporated | Test Location: | Taipei, R.O.C. | Test Date: | Aug 17, 2010 |
| Hardware Availability: | Jun-2010 | Software Availability: | Dec-2009 | Publication: | Oct 6, 2010 |
| System Source: | Single Supplier | System Designation: | Server | Power Provisioning: | Line-powered |
| Target Load | Actual Load | ssj_ops | |
|---|---|---|---|
| Target | Actual | ||
| Calibration 1 | 902,757 | ||
| Calibration 2 | 905,537 | ||
| Calibration 3 | 903,366 | ||
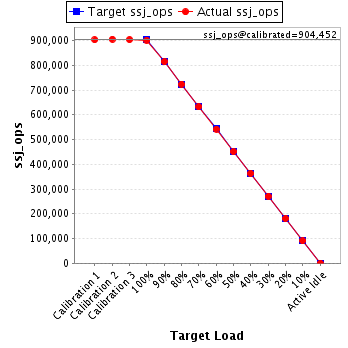
| ssj_ops@calibrated=904,452 | |||
| 100% | 99.7% | 904,452 | 901,396 |
| 90% | 90.1% | 814,007 | 814,497 |
| 80% | 80.1% | 723,561 | 724,143 |
| 70% | 69.9% | 633,116 | 632,011 |
| 60% | 60.0% | 542,671 | 542,332 |
| 50% | 49.9% | 452,226 | 451,003 |
| 40% | 40.2% | 361,781 | 363,425 |
| 30% | 29.9% | 271,336 | 270,859 |
| 20% | 20.0% | 180,890 | 180,641 |
| 10% | 10.0% | 90,445 | 90,626 |
| Active Idle | 0 | 0 | |
| Set Identifier: | sut |
| Set Description: | System Under Test |
| # of Identical Nodes: | 1 |
| Comment: | None |
| Hardware | |
|---|---|
| Hardware Vendor: | Acer Incorporated |
| Model: | Acer AT150 F1(Intel Xeon X5670, 2.93 GHz) |
| Form Factor: | Tower |
| CPU Name: | Intel Xeon X5670 |
| CPU Characteristics: | Six-Core, 2.93 GHz, 12 MB L3 cache |
| CPU Frequency (MHz): | 2933 |
| CPU(s) Enabled: | 12 cores, 2 chips, 6 cores/chip |
| Hardware Threads: | 24 (2 / core) |
| CPU(s) Orderable: | 1,2 chips |
| Primary Cache: | 32 KB I + 32 KB D on chip per core |
| Secondary Cache: | 256 KB I+D on chip per core |
| Tertiary Cache: | 12 MB I+D on chip per chip |
| Other Cache: | None |
| Memory Amount (GB): | 12 |
| # and size of DIMM: | 6 x 2048 MB |
| Memory Details: | 2GB 2Rx8 PC3-10600E; slots 1A, 2A, and 3A populated on each processor |
| Power Supply Quantity and Rating (W): | 1 x 560 |
| Power Supply Details: | PWS-563-1H |
| Disk Drive: | 1 x 64GB SSD 2.5" SATA |
| Disk Controller: | onboard SATA controller |
| # and type of Network Interface Cards (NICs) Installed: | 1 x Dual-port Intel 82576EB Gigabit Ethernet controller |
| NICs Enabled in Firmware / OS / Connected: | 2/2/1 |
| Network Speed (Mbit): | 1000 |
| Keyboard: | PS2 |
| Mouse: | PS2 |
| Monitor: | Direct |
| Optical Drives: | No |
| Other Hardware: | None |
| Software | |
|---|---|
| Power Management: | Power save enabled in OS |
| Operating System (OS): | Windows Server 2008, Enterprise Edition |
| OS Version: | R2 |
| Filesystem: | NTFS |
| JVM Vendor: | IBM Corporation |
| JVM Version: | IBM J9 VM (build 2.4, JRE 1.6.0 IBM J9 2.4 Windows Server 2008 amd64-64 jvmwa6460sr7-20091214_49398 (JIT enabled, AOT enabled) |
| JVM Command-line Options: | -Xmn1100m -Xms1500m -Xmx1500m -Xaggressive -Xcompressedrefs -Xgcpolicy:gencon -XlockReservation -Xnoloa -XtlhPrefetch -Xlp |
| JVM Affinity: | start /affinity [0xF, 0xF0, 0xF00,0xF000, 0xF0000, 0xF00000] |
| JVM Instances: | 6 |
| JVM Initial Heap (MB): | 1500 |
| JVM Maximum Heap (MB): | 1500 |
| JVM Address Bits: | 64 |
| Boot Firmware Version: | P03 |
| Management Firmware Version: | 1.01 |
| Workload Version: | SSJ 1.2.6 |
| Director Location: | Controller |
| Other Software: | None |
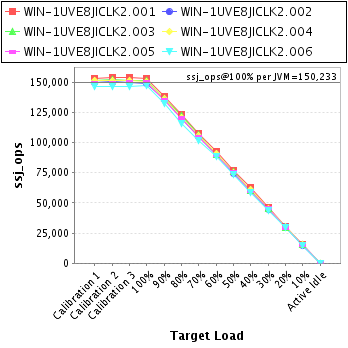
| JVM Instance | ssj_ops@100% |
|---|---|
| WIN-1UVE8JICLK2.001 | 152,874 |
| WIN-1UVE8JICLK2.002 | 149,434 |
| WIN-1UVE8JICLK2.003 | 151,595 |
| WIN-1UVE8JICLK2.004 | 150,512 |
| WIN-1UVE8JICLK2.005 | 149,933 |
| WIN-1UVE8JICLK2.006 | 147,049 |
| ssj_ops@100% | 901,396 |
| ssj_ops@100% per JVM | 150,233 |
| Target Load | Actual Load | ssj_ops | |
|---|---|---|---|
| Target | Actual | ||
| Calibration 1 | 152,960 | ||
| Calibration 2 | 154,277 | ||
| Calibration 3 | 153,689 | ||
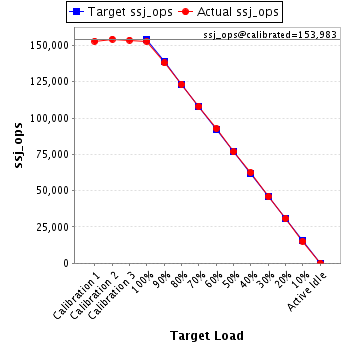
| ssj_ops@calibrated=153,983 | |||
| 100% | 99.3% | 153,983 | 152,874 |
| 90% | 89.6% | 138,585 | 137,980 |
| 80% | 80.0% | 123,186 | 123,252 |
| 70% | 70.1% | 107,788 | 107,978 |
| 60% | 60.2% | 92,390 | 92,746 |
| 50% | 49.8% | 76,992 | 76,675 |
| 40% | 40.6% | 61,593 | 62,459 |
| 30% | 29.9% | 46,195 | 45,971 |
| 20% | 20.0% | 30,797 | 30,829 |
| 10% | 9.9% | 15,398 | 15,173 |
| Active Idle | 0 | 0 | |
| Target Load | Actual Load | ssj_ops | |
|---|---|---|---|
| Target | Actual | ||
| Calibration 1 | 150,065 | ||
| Calibration 2 | 151,013 | ||
| Calibration 3 | 150,007 | ||
| ssj_ops@calibrated=150,510 | |||
| 100% | 99.3% | 150,510 | 149,434 |
| 90% | 90.3% | 135,459 | 135,905 |
| 80% | 80.0% | 120,408 | 120,422 |
| 70% | 69.8% | 105,357 | 105,004 |
| 60% | 59.8% | 90,306 | 89,996 |
| 50% | 49.3% | 75,255 | 74,240 |
| 40% | 40.2% | 60,204 | 60,532 |
| 30% | 29.7% | 45,153 | 44,732 |
| 20% | 20.2% | 30,102 | 30,386 |
| 10% | 9.9% | 15,051 | 14,840 |
| Active Idle | 0 | 0 | |

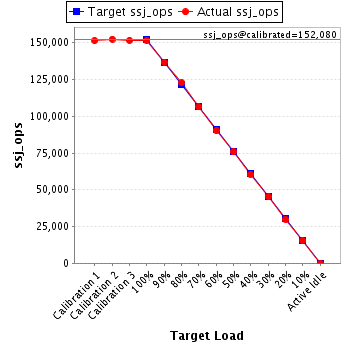
| Target Load | Actual Load | ssj_ops | |
|---|---|---|---|
| Target | Actual | ||
| Calibration 1 | 151,514 | ||
| Calibration 2 | 152,476 | ||
| Calibration 3 | 151,683 | ||
| ssj_ops@calibrated=152,080 | |||
| 100% | 99.7% | 152,080 | 151,595 |
| 90% | 90.0% | 136,872 | 136,854 |
| 80% | 80.7% | 121,664 | 122,783 |
| 70% | 70.0% | 106,456 | 106,468 |
| 60% | 59.3% | 91,248 | 90,183 |
| 50% | 49.8% | 76,040 | 75,764 |
| 40% | 39.7% | 60,832 | 60,419 |
| 30% | 29.9% | 45,624 | 45,462 |
| 20% | 19.6% | 30,416 | 29,865 |
| 10% | 10.1% | 15,208 | 15,366 |
| Active Idle | 0 | 0 | |
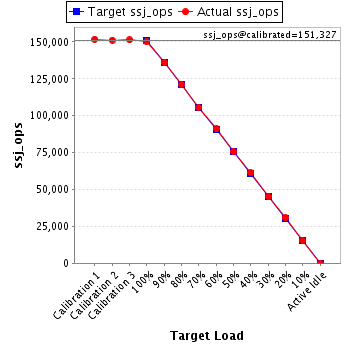
| Target Load | Actual Load | ssj_ops | |
|---|---|---|---|
| Target | Actual | ||
| Calibration 1 | 151,918 | ||
| Calibration 2 | 151,286 | ||
| Calibration 3 | 151,369 | ||
| ssj_ops@calibrated=151,327 | |||
| 100% | 99.5% | 151,327 | 150,512 |
| 90% | 90.0% | 136,195 | 136,198 |
| 80% | 80.1% | 121,062 | 121,255 |
| 70% | 69.8% | 105,929 | 105,660 |
| 60% | 60.3% | 90,796 | 91,202 |
| 50% | 50.0% | 75,664 | 75,608 |
| 40% | 40.6% | 60,531 | 61,451 |
| 30% | 30.1% | 45,398 | 45,488 |
| 20% | 20.3% | 30,265 | 30,735 |
| 10% | 10.0% | 15,133 | 15,179 |
| Active Idle | 0 | 0 | |
| Target Load | Actual Load | ssj_ops | |
|---|---|---|---|
| Target | Actual | ||
| Calibration 1 | 149,653 | ||
| Calibration 2 | 149,702 | ||
| Calibration 3 | 149,983 | ||
| ssj_ops@calibrated=149,843 | |||
| 100% | 100.1% | 149,843 | 149,933 |
| 90% | 90.1% | 134,858 | 135,003 |
| 80% | 80.2% | 119,874 | 120,156 |
| 70% | 70.0% | 104,890 | 104,900 |
| 60% | 59.9% | 89,906 | 89,716 |
| 50% | 50.2% | 74,921 | 75,290 |
| 40% | 40.0% | 59,937 | 59,875 |
| 30% | 30.4% | 44,953 | 45,561 |
| 20% | 19.7% | 29,969 | 29,531 |
| 10% | 10.2% | 14,984 | 15,294 |
| Active Idle | 0 | 0 | |

| Target Load | Actual Load | ssj_ops | |
|---|---|---|---|
| Target | Actual | ||
| Calibration 1 | 146,645 | ||
| Calibration 2 | 146,783 | ||
| Calibration 3 | 146,634 | ||
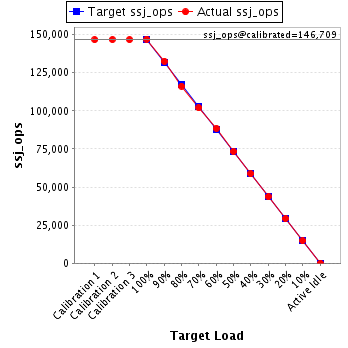
| ssj_ops@calibrated=146,709 | |||
| 100% | 100.2% | 146,709 | 147,049 |
| 90% | 90.4% | 132,038 | 132,558 |
| 80% | 79.3% | 117,367 | 116,275 |
| 70% | 69.5% | 102,696 | 102,001 |
| 60% | 60.3% | 88,025 | 88,488 |
| 50% | 50.0% | 73,354 | 73,427 |
| 40% | 40.0% | 58,683 | 58,689 |
| 30% | 29.7% | 44,013 | 43,644 |
| 20% | 20.0% | 29,342 | 29,296 |
| 10% | 10.1% | 14,671 | 14,775 |
| Active Idle | 0 | 0 | |