SPECpower_ssj2008
Aggregate Performance Report
Copyright © 2007-2010 Standard Performance Evaluation Corporation
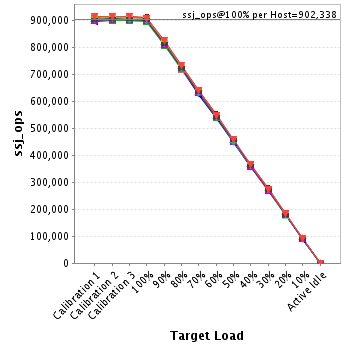
| Dell Inc. PowerEdge M610 | ssj_ops@100% = 14,437,407 ssj_ops@100% per Host = 902,338 ssj_ops@100% per JVM = 150,390 |
||||
| Test Sponsor: | Dell Inc. | SPEC License #: | 55 | Test Method: | Multi Node |
| Tested By: | Dell Inc. | Test Location: | Round Rock, TX, USA | Test Date: | Aug 12, 2010 |
| Hardware Availability: | Sep-2010 | Software Availability: | Jul-2009 | Publication: | Sep 9, 2010 |
| System Source: | Single Supplier | System Designation: | Server | Power Provisioning: | Line-powered |
| Target Load | Actual Load | ssj_ops | |
|---|---|---|---|
| Target | Actual | ||
| Calibration 1 | 14,477,014 | ||
| Calibration 2 | 14,520,749 | ||
| Calibration 3 | 14,495,824 | ||
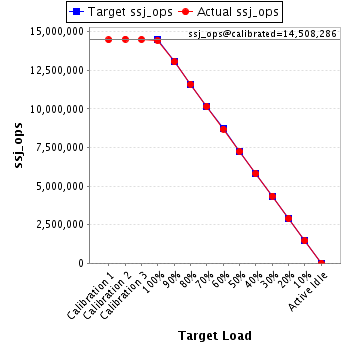
| ssj_ops@calibrated=14,508,286 | |||
| 100% | 99.5% | 14,508,286 | 14,437,407 |
| 90% | 90.0% | 13,057,458 | 13,059,903 |
| 80% | 80.0% | 11,606,629 | 11,611,558 |
| 70% | 70.0% | 10,155,800 | 10,155,306 |
| 60% | 60.0% | 8,704,972 | 8,699,021 |
| 50% | 50.0% | 7,254,143 | 7,250,931 |
| 40% | 40.0% | 5,803,315 | 5,803,201 |
| 30% | 30.0% | 4,352,486 | 4,357,138 |
| 20% | 20.0% | 2,901,657 | 2,900,976 |
| 10% | 10.0% | 1,450,829 | 1,457,648 |
| Active Idle | 0 | 0 | |
| # of Nodes | # of Chips | # of Cores | # of Threads | Total RAM (GB) | # of OS Images | # of JVM Instances |
|---|---|---|---|---|---|---|
| 16 | 32 | 192 | 384 | 192 | 16 | 96 |
| Set Identifier: | sut |
| Set Description: | PowerEdge M610 |
| # of Identical Nodes: | 16 |
| Comment: | None |
| Software per Node | |
|---|---|
| Power Management: | Power Saver Mode in OS (See Notes) |
| Operating System (OS): | Windows 2008 Server Enterprise x64 Edition |
| OS Version: | R2 |
| Filesystem: | NTFS |
| JVM Vendor: | IBM Corporation |
| JVM Version: | IBM J9 VM (build 2.4, J2RE 1.6.0 IBM J9 2.4 Windows Server 2008 amd64-64 jvmwa64 60sr5-20090519_35743 (JIT enabled, AOT enabled) |
| JVM Command-line Options: | -Xmn1100m -Xms1500m -Xmx1500m -Xaggressive -Xcompressedrefs -Xgcpolicy:gencon -XlockReservation -Xnoloa -XtlhPrefetch -Xlp |
| JVM Affinity: | start /affinity [F,F0,F00,F000,F0000,F00000] |
| JVM Instances: | 6 |
| JVM Initial Heap (MB): | 1500 |
| JVM Maximum Heap (MB): | 1500 |
| JVM Address Bits: | 64 |
| Boot Firmware Version: | 2.1.9 |
| Management Firmware Version: | iDRAC 3.0.0 A02 / CMC 3.0.1 A00 |
| Workload Version: | SSJ 1.2.6 |
| Director Location: | Controller |
| Other Software: | None |
| Host | ssj_ops@100% |
|---|---|
| M610-1 | 897,621 |
| M610-10 | 907,718 |
| M610-11 | 902,343 |
| M610-12 | 901,110 |
| M610-13 | 895,242 |
| M610-14 | 898,232 |
| M610-15 | 902,147 |
| M610-16 | 908,730 |
| M610-2 | 909,991 |
| M610-3 | 899,818 |
| M610-4 | 896,317 |
| M610-5 | 906,159 |
| M610-6 | 899,691 |
| M610-7 | 901,243 |
| M610-8 | 901,737 |
| M610-9 | 909,310 |
| ssj_ops@100% | 14,437,407 |
| ssj_ops@100% per Host | 902,338 |
| ssj_ops@100% per JVM | 150,390 |
| Target Load | Actual Load | ssj_ops | |
|---|---|---|---|
| Target | Actual | ||
| Calibration 1 | 900,589 | ||
| Calibration 2 | 903,503 | ||
| Calibration 3 | 899,529 | ||
| ssj_ops@calibrated=901,516 | |||
| 100% | 99.6% | 901,516 | 897,621 |
| 90% | 89.8% | 811,364 | 809,795 |
| 80% | 79.7% | 721,213 | 718,852 |
| 70% | 70.1% | 631,061 | 631,934 |
| 60% | 60.0% | 540,909 | 541,023 |
| 50% | 50.0% | 450,758 | 450,317 |
| 40% | 39.9% | 360,606 | 359,380 |
| 30% | 30.0% | 270,455 | 270,442 |
| 20% | 20.0% | 180,303 | 180,076 |
| 10% | 10.1% | 90,152 | 90,965 |
| Active Idle | 0 | 0 | |

| Target Load | Actual Load | ssj_ops | |
|---|---|---|---|
| Target | Actual | ||
| Calibration 1 | 910,512 | ||
| Calibration 2 | 911,596 | ||
| Calibration 3 | 912,202 | ||
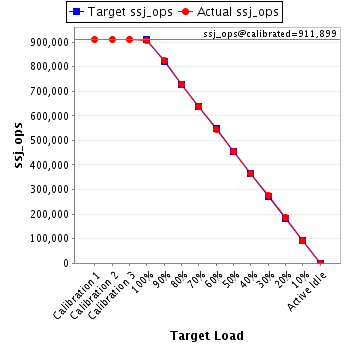
| ssj_ops@calibrated=911,899 | |||
| 100% | 99.5% | 911,899 | 907,718 |
| 90% | 90.3% | 820,709 | 823,725 |
| 80% | 79.9% | 729,519 | 728,412 |
| 70% | 70.1% | 638,329 | 639,442 |
| 60% | 59.9% | 547,139 | 546,324 |
| 50% | 49.9% | 455,949 | 455,050 |
| 40% | 40.0% | 364,760 | 364,623 |
| 30% | 30.2% | 273,570 | 275,409 |
| 20% | 20.2% | 182,380 | 184,287 |
| 10% | 10.0% | 91,190 | 91,200 |
| Active Idle | 0 | 0 | |
| Target Load | Actual Load | ssj_ops | |
|---|---|---|---|
| Target | Actual | ||
| Calibration 1 | 901,819 | ||
| Calibration 2 | 904,894 | ||
| Calibration 3 | 902,080 | ||
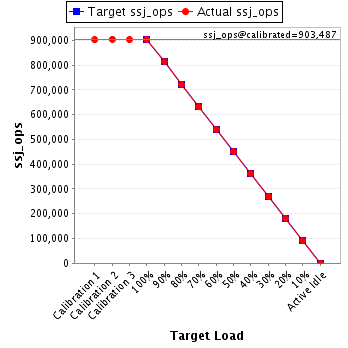
| ssj_ops@calibrated=903,487 | |||
| 100% | 99.9% | 903,487 | 902,343 |
| 90% | 90.0% | 813,138 | 813,320 |
| 80% | 80.0% | 722,789 | 722,662 |
| 70% | 69.9% | 632,441 | 631,575 |
| 60% | 59.9% | 542,092 | 541,532 |
| 50% | 49.8% | 451,743 | 450,200 |
| 40% | 40.1% | 361,395 | 362,326 |
| 30% | 29.9% | 271,046 | 269,708 |
| 20% | 19.8% | 180,697 | 178,988 |
| 10% | 10.0% | 90,349 | 90,011 |
| Active Idle | 0 | 0 | |
| Target Load | Actual Load | ssj_ops | |
|---|---|---|---|
| Target | Actual | ||
| Calibration 1 | 909,205 | ||
| Calibration 2 | 905,894 | ||
| Calibration 3 | 904,156 | ||
| ssj_ops@calibrated=905,025 | |||
| 100% | 99.6% | 905,025 | 901,110 |
| 90% | 90.1% | 814,522 | 815,231 |
| 80% | 80.2% | 724,020 | 725,574 |
| 70% | 69.9% | 633,517 | 632,898 |
| 60% | 60.0% | 543,015 | 543,202 |
| 50% | 50.0% | 452,512 | 452,078 |
| 40% | 40.0% | 362,010 | 362,411 |
| 30% | 30.1% | 271,507 | 272,099 |
| 20% | 20.0% | 181,005 | 180,844 |
| 10% | 10.0% | 90,502 | 90,788 |
| Active Idle | 0 | 0 | |

| Target Load | Actual Load | ssj_ops | |
|---|---|---|---|
| Target | Actual | ||
| Calibration 1 | 900,683 | ||
| Calibration 2 | 899,364 | ||
| Calibration 3 | 900,568 | ||
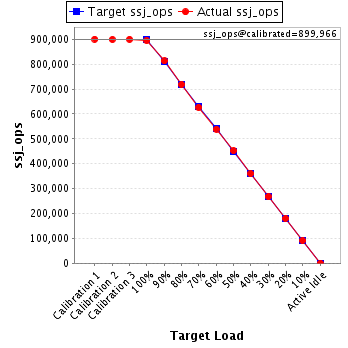
| ssj_ops@calibrated=899,966 | |||
| 100% | 99.5% | 899,966 | 895,242 |
| 90% | 90.3% | 809,969 | 812,953 |
| 80% | 79.8% | 719,973 | 718,290 |
| 70% | 69.6% | 629,976 | 626,565 |
| 60% | 59.9% | 539,980 | 539,351 |
| 50% | 50.3% | 449,983 | 452,272 |
| 40% | 40.0% | 359,986 | 359,852 |
| 30% | 29.8% | 269,990 | 267,827 |
| 20% | 20.1% | 179,993 | 180,654 |
| 10% | 10.2% | 89,997 | 91,390 |
| Active Idle | 0 | 0 | |
| Target Load | Actual Load | ssj_ops | |
|---|---|---|---|
| Target | Actual | ||
| Calibration 1 | 899,172 | ||
| Calibration 2 | 904,826 | ||
| Calibration 3 | 902,200 | ||
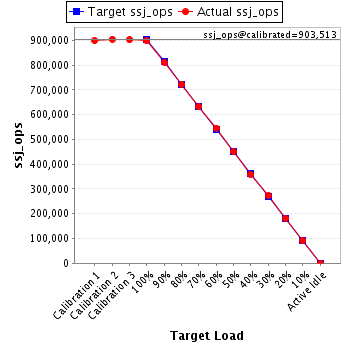
| ssj_ops@calibrated=903,513 | |||
| 100% | 99.4% | 903,513 | 898,232 |
| 90% | 89.8% | 813,162 | 811,536 |
| 80% | 80.0% | 722,810 | 723,236 |
| 70% | 70.0% | 632,459 | 632,058 |
| 60% | 60.4% | 542,108 | 545,899 |
| 50% | 49.8% | 451,757 | 449,513 |
| 40% | 39.9% | 361,405 | 360,292 |
| 30% | 30.2% | 271,054 | 272,711 |
| 20% | 20.1% | 180,703 | 181,812 |
| 10% | 10.1% | 90,351 | 91,221 |
| Active Idle | 0 | 0 | |
| Target Load | Actual Load | ssj_ops | |
|---|---|---|---|
| Target | Actual | ||
| Calibration 1 | 906,728 | ||
| Calibration 2 | 910,425 | ||
| Calibration 3 | 907,797 | ||
| ssj_ops@calibrated=909,111 | |||
| 100% | 99.2% | 909,111 | 902,147 |
| 90% | 90.1% | 818,200 | 819,000 |
| 80% | 80.0% | 727,289 | 726,979 |
| 70% | 70.3% | 636,378 | 638,651 |
| 60% | 60.0% | 545,467 | 545,864 |
| 50% | 50.1% | 454,556 | 455,597 |
| 40% | 40.1% | 363,644 | 364,357 |
| 30% | 30.1% | 272,733 | 273,535 |
| 20% | 20.0% | 181,822 | 181,752 |
| 10% | 10.1% | 90,911 | 91,962 |
| Active Idle | 0 | 0 | |

| Target Load | Actual Load | ssj_ops | |
|---|---|---|---|
| Target | Actual | ||
| Calibration 1 | 907,612 | ||
| Calibration 2 | 913,814 | ||
| Calibration 3 | 911,968 | ||
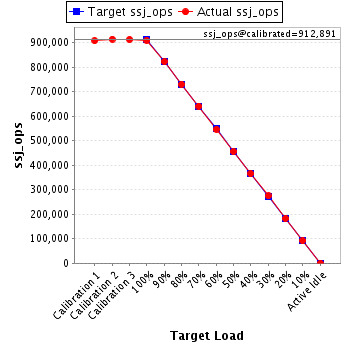
| ssj_ops@calibrated=912,891 | |||
| 100% | 99.5% | 912,891 | 908,730 |
| 90% | 90.1% | 821,602 | 822,139 |
| 80% | 80.0% | 730,313 | 730,226 |
| 70% | 70.2% | 639,024 | 640,560 |
| 60% | 59.8% | 547,735 | 546,242 |
| 50% | 50.0% | 456,445 | 456,341 |
| 40% | 40.0% | 365,156 | 365,023 |
| 30% | 30.1% | 273,867 | 274,384 |
| 20% | 20.0% | 182,578 | 182,575 |
| 10% | 10.1% | 91,289 | 91,771 |
| Active Idle | 0 | 0 | |
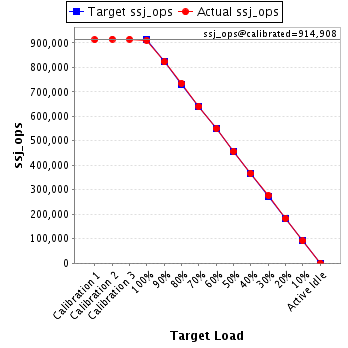
| Target Load | Actual Load | ssj_ops | |
|---|---|---|---|
| Target | Actual | ||
| Calibration 1 | 912,522 | ||
| Calibration 2 | 914,979 | ||
| Calibration 3 | 914,837 | ||
| ssj_ops@calibrated=914,908 | |||
| 100% | 99.5% | 914,908 | 909,991 |
| 90% | 89.9% | 823,417 | 822,445 |
| 80% | 80.3% | 731,926 | 735,015 |
| 70% | 70.0% | 640,435 | 640,085 |
| 60% | 60.1% | 548,945 | 550,172 |
| 50% | 49.9% | 457,454 | 456,610 |
| 40% | 40.1% | 365,963 | 366,507 |
| 30% | 30.2% | 274,472 | 276,549 |
| 20% | 20.0% | 182,982 | 183,039 |
| 10% | 10.0% | 91,491 | 91,229 |
| Active Idle | 0 | 0 | |
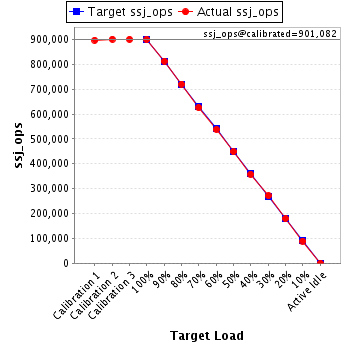
| Target Load | Actual Load | ssj_ops | |
|---|---|---|---|
| Target | Actual | ||
| Calibration 1 | 897,572 | ||
| Calibration 2 | 901,321 | ||
| Calibration 3 | 900,843 | ||
| ssj_ops@calibrated=901,082 | |||
| 100% | 99.9% | 901,082 | 899,818 |
| 90% | 90.2% | 810,974 | 812,897 |
| 80% | 80.0% | 720,866 | 720,955 |
| 70% | 69.5% | 630,758 | 625,946 |
| 60% | 59.7% | 540,649 | 538,366 |
| 50% | 49.8% | 450,541 | 448,995 |
| 40% | 39.7% | 360,433 | 357,919 |
| 30% | 30.1% | 270,325 | 271,295 |
| 20% | 19.9% | 180,216 | 179,644 |
| 10% | 9.9% | 90,108 | 89,515 |
| Active Idle | 0 | 0 | |
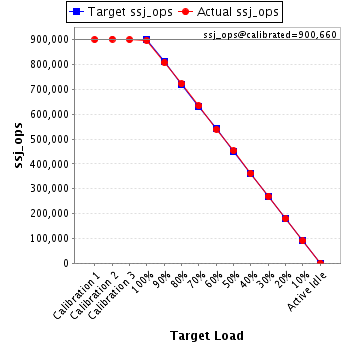
| Target Load | Actual Load | ssj_ops | |
|---|---|---|---|
| Target | Actual | ||
| Calibration 1 | 900,270 | ||
| Calibration 2 | 901,912 | ||
| Calibration 3 | 899,408 | ||
| ssj_ops@calibrated=900,660 | |||
| 100% | 99.5% | 900,660 | 896,317 |
| 90% | 89.7% | 810,594 | 808,163 |
| 80% | 80.2% | 720,528 | 722,140 |
| 70% | 70.3% | 630,462 | 633,065 |
| 60% | 59.9% | 540,396 | 539,328 |
| 50% | 50.2% | 450,330 | 452,196 |
| 40% | 40.1% | 360,264 | 361,524 |
| 30% | 29.9% | 270,198 | 269,482 |
| 20% | 19.9% | 180,132 | 179,237 |
| 10% | 10.0% | 90,066 | 90,222 |
| Active Idle | 0 | 0 | |
| Target Load | Actual Load | ssj_ops | |
|---|---|---|---|
| Target | Actual | ||
| Calibration 1 | 909,266 | ||
| Calibration 2 | 913,614 | ||
| Calibration 3 | 911,472 | ||
| ssj_ops@calibrated=912,543 | |||
| 100% | 99.3% | 912,543 | 906,159 |
| 90% | 90.2% | 821,288 | 823,173 |
| 80% | 80.0% | 730,034 | 729,775 |
| 70% | 70.0% | 638,780 | 638,769 |
| 60% | 59.9% | 547,526 | 546,711 |
| 50% | 50.0% | 456,271 | 456,385 |
| 40% | 40.2% | 365,017 | 367,276 |
| 30% | 30.2% | 273,763 | 275,335 |
| 20% | 20.1% | 182,509 | 183,824 |
| 10% | 10.0% | 91,254 | 91,014 |
| Active Idle | 0 | 0 | |

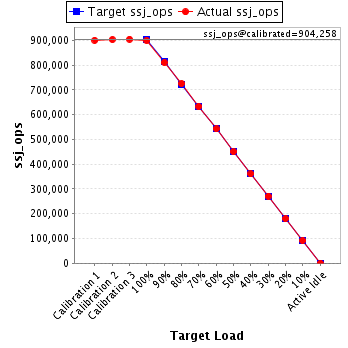
| Target Load | Actual Load | ssj_ops | |
|---|---|---|---|
| Target | Actual | ||
| Calibration 1 | 900,985 | ||
| Calibration 2 | 903,308 | ||
| Calibration 3 | 905,207 | ||
| ssj_ops@calibrated=904,258 | |||
| 100% | 99.5% | 904,258 | 899,691 |
| 90% | 89.7% | 813,832 | 810,942 |
| 80% | 80.3% | 723,406 | 725,772 |
| 70% | 70.0% | 632,980 | 633,015 |
| 60% | 60.0% | 542,555 | 542,835 |
| 50% | 49.8% | 452,129 | 450,400 |
| 40% | 39.9% | 361,703 | 360,625 |
| 30% | 30.0% | 271,277 | 271,382 |
| 20% | 19.9% | 180,852 | 179,751 |
| 10% | 10.1% | 90,426 | 91,705 |
| Active Idle | 0 | 0 | |
| Target Load | Actual Load | ssj_ops | |
|---|---|---|---|
| Target | Actual | ||
| Calibration 1 | 903,008 | ||
| Calibration 2 | 908,913 | ||
| Calibration 3 | 905,151 | ||
| ssj_ops@calibrated=907,032 | |||
| 100% | 99.4% | 907,032 | 901,243 |
| 90% | 89.9% | 816,328 | 815,038 |
| 80% | 80.0% | 725,625 | 725,249 |
| 70% | 70.0% | 634,922 | 634,963 |
| 60% | 59.9% | 544,219 | 543,466 |
| 50% | 49.8% | 453,516 | 452,141 |
| 40% | 40.1% | 362,813 | 364,041 |
| 30% | 30.0% | 272,109 | 272,229 |
| 20% | 20.0% | 181,406 | 181,257 |
| 10% | 10.1% | 90,703 | 91,476 |
| Active Idle | 0 | 0 | |

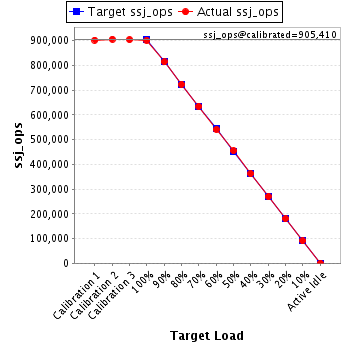
| Target Load | Actual Load | ssj_ops | |
|---|---|---|---|
| Target | Actual | ||
| Calibration 1 | 903,141 | ||
| Calibration 2 | 906,628 | ||
| Calibration 3 | 904,192 | ||
| ssj_ops@calibrated=905,410 | |||
| 100% | 99.6% | 905,410 | 901,737 |
| 90% | 90.0% | 814,869 | 814,463 |
| 80% | 80.0% | 724,328 | 723,983 |
| 70% | 70.1% | 633,787 | 634,560 |
| 60% | 59.8% | 543,246 | 541,062 |
| 50% | 50.3% | 452,705 | 455,379 |
| 40% | 40.0% | 362,164 | 362,141 |
| 30% | 29.8% | 271,623 | 270,052 |
| 20% | 19.9% | 181,082 | 179,912 |
| 10% | 10.0% | 90,541 | 90,702 |
| Active Idle | 0 | 0 | |
| Target Load | Actual Load | ssj_ops | |
|---|---|---|---|
| Target | Actual | ||
| Calibration 1 | 913,930 | ||
| Calibration 2 | 915,759 | ||
| Calibration 3 | 914,215 | ||
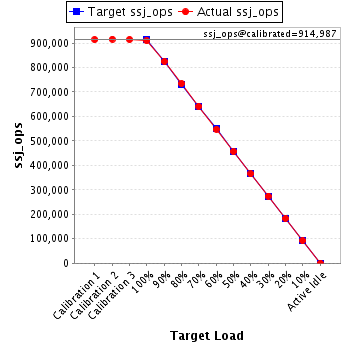
| ssj_ops@calibrated=914,987 | |||
| 100% | 99.4% | 914,987 | 909,310 |
| 90% | 90.2% | 823,488 | 825,084 |
| 80% | 80.3% | 731,990 | 734,438 |
| 70% | 70.1% | 640,491 | 641,222 |
| 60% | 59.9% | 548,992 | 547,643 |
| 50% | 50.0% | 457,494 | 457,459 |
| 40% | 39.9% | 365,995 | 364,905 |
| 30% | 30.0% | 274,496 | 274,696 |
| 20% | 20.0% | 182,997 | 183,325 |
| 10% | 10.1% | 91,499 | 92,476 |
| Active Idle | 0 | 0 | |