SPECpower_ssj2008
Host 'WIN-SSOJHFLOP15' Performance Report
Copyright © 2007-2010 Standard Performance Evaluation Corporation
| Dell Inc. PowerEdge R610 (Intel Xeon X5670, 2.93 GHz) | ssj_ops@100% = 914,076 ssj_ops@100% per JVM = 152,346 |
||||
| Test Sponsor: | Dell Inc. | SPEC License #: | 55 | Test Method: | Single Node |
| Tested By: | Dell Inc. | Test Location: | Round Rock, TX, USA | Test Date: | May 1, 2010 |
| Hardware Availability: | Jul-2010 | Software Availability: | Sep-2009 | Publication: | May 19, 2010 |
| System Source: | Single Supplier | System Designation: | Server | Power Provisioning: | Line-powered |
| Target Load | Actual Load | ssj_ops | |
|---|---|---|---|
| Target | Actual | ||
| Calibration 1 | 915,916 | ||
| Calibration 2 | 919,842 | ||
| Calibration 3 | 920,180 | ||
| ssj_ops@calibrated=920,011 | |||
| 100% | 99.4% | 920,011 | 914,076 |
| 90% | 89.7% | 828,010 | 825,506 |
| 80% | 80.4% | 736,009 | 739,906 |
| 70% | 70.1% | 644,008 | 644,895 |
| 60% | 59.6% | 552,006 | 547,883 |
| 50% | 49.8% | 460,005 | 458,558 |
| 40% | 40.4% | 368,004 | 371,934 |
| 30% | 30.1% | 276,003 | 276,664 |
| 20% | 20.0% | 184,002 | 184,309 |
| 10% | 9.9% | 92,001 | 91,172 |
| Active Idle | 0 | 0 | |

| Set Identifier: | sut |
| Set Description: | System Under Test |
| # of Identical Nodes: | 1 |
| Comment: | None |
| Hardware | |
|---|---|
| Hardware Vendor: | Dell Inc. |
| Model: | PowerEdge R610 (Intel Xeon X5670, 2.93 GHz) |
| Form Factor: | 1U |
| CPU Name: | Intel Xeon X5670 |
| CPU Characteristics: | Six Core, 2.93 GHz, 12 MB L3 Cache |
| CPU Frequency (MHz): | 2933 |
| CPU(s) Enabled: | 12 cores, 2 chips, 6 cores/chip |
| Hardware Threads: | 24 (2 / core) |
| CPU(s) Orderable: | 1,2 chip |
| Primary Cache: | 32 KB I + 32 KB D on chip per core |
| Secondary Cache: | 256 KB I+D on chip per core |
| Tertiary Cache: | 12 MB I+D on chip per chip |
| Other Cache: | None |
| Memory Amount (GB): | 12 |
| # and size of DIMM: | 6 x 2048 MB |
| Memory Details: | 2GB 2Rx8 PC3L-10600R (running at 1066MHz) ECC, Slots A1-A3, B1-B3 populated |
| Power Supply Quantity and Rating (W): | 1 x 502 |
| Power Supply Details: | Dell PN KY091 |
| Disk Drive: | 1 x 50 GB SSD SATA (Dell PN Y949P) |
| Disk Controller: | H200 Integrated |
| # and type of Network Interface Cards (NICs) Installed: | 2 x onboard dual-port gigabit |
| NICs Enabled in Firmware / OS / Connected: | 2/1/1 |
| Network Speed (Mbit): | 1000 |
| Keyboard: | None |
| Mouse: | None |
| Monitor: | None |
| Optical Drives: | No |
| Other Hardware: | None |
| Software | |
|---|---|
| Power Management: | Power Saver Mode Enabled in OS |
| Operating System (OS): | Windows 2008 Server Enterprise x64 Edition |
| OS Version: | R2 |
| Filesystem: | NTFS |
| JVM Vendor: | IBM Corporation |
| JVM Version: | IBM J9 VM (build 2.4, J2RE 1.6.0 IBM J9 2.4 Windows Server 2008 amd64-64 jvmwa64 60sr5-20090519_35743 (JIT enabled, AOT enabled) |
| JVM Command-line Options: | -Xmn1100m -Xms1500m -Xmx1500m -Xaggressive -Xcompressedrefs -Xgcpolicy:gencon -XlockReservation -Xnoloa -XtlhPrefetch -Xlp |
| JVM Affinity: | start /affinity [F,F0,F00,F000,F0000,F00000] |
| JVM Instances: | 6 |
| JVM Initial Heap (MB): | 1500 |
| JVM Maximum Heap (MB): | 1500 |
| JVM Address Bits: | 64 |
| Boot Firmware Version: | 2.1.4 |
| Management Firmware Version: | X09 1.5.0 |
| Workload Version: | SSJ 1.2.6 |
| Director Location: | Controller |
| Other Software: | None |
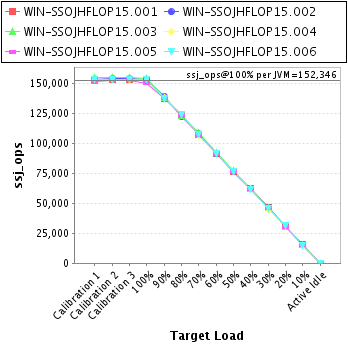
| JVM Instance | ssj_ops@100% |
|---|---|
| WIN-SSOJHFLOP15.001 | 152,440 |
| WIN-SSOJHFLOP15.002 | 152,670 |
| WIN-SSOJHFLOP15.003 | 154,177 |
| WIN-SSOJHFLOP15.004 | 151,582 |
| WIN-SSOJHFLOP15.005 | 149,962 |
| WIN-SSOJHFLOP15.006 | 153,244 |
| ssj_ops@100% | 914,076 |
| ssj_ops@100% per JVM | 152,346 |
| Target Load | Actual Load | ssj_ops | |
|---|---|---|---|
| Target | Actual | ||
| Calibration 1 | 152,475 | ||
| Calibration 2 | 153,148 | ||
| Calibration 3 | 153,025 | ||
| ssj_ops@calibrated=153,087 | |||
| 100% | 99.6% | 153,087 | 152,440 |
| 90% | 89.4% | 137,778 | 136,925 |
| 80% | 81.1% | 122,469 | 124,189 |
| 70% | 69.8% | 107,161 | 106,886 |
| 60% | 59.4% | 91,852 | 90,968 |
| 50% | 49.8% | 76,543 | 76,309 |
| 40% | 40.7% | 61,235 | 62,288 |
| 30% | 30.1% | 45,926 | 46,139 |
| 20% | 20.0% | 30,617 | 30,612 |
| 10% | 10.1% | 15,309 | 15,507 |
| Active Idle | 0 | 0 | |

| Target Load | Actual Load | ssj_ops | |
|---|---|---|---|
| Target | Actual | ||
| Calibration 1 | 152,930 | ||
| Calibration 2 | 153,576 | ||
| Calibration 3 | 153,492 | ||
| ssj_ops@calibrated=153,534 | |||
| 100% | 99.4% | 153,534 | 152,670 |
| 90% | 90.1% | 138,181 | 138,394 |
| 80% | 79.4% | 122,827 | 121,961 |
| 70% | 70.3% | 107,474 | 107,942 |
| 60% | 59.4% | 92,120 | 91,170 |
| 50% | 49.6% | 76,767 | 76,206 |
| 40% | 40.7% | 61,414 | 62,461 |
| 30% | 30.3% | 46,060 | 46,512 |
| 20% | 19.9% | 30,707 | 30,593 |
| 10% | 10.0% | 15,353 | 15,404 |
| Active Idle | 0 | 0 | |

| Target Load | Actual Load | ssj_ops | |
|---|---|---|---|
| Target | Actual | ||
| Calibration 1 | 154,331 | ||
| Calibration 2 | 154,805 | ||
| Calibration 3 | 154,879 | ||
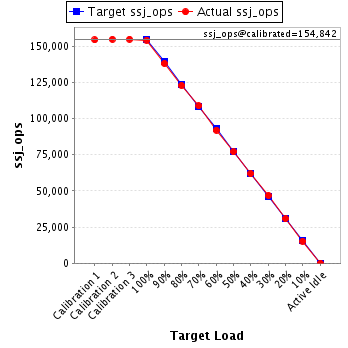
| ssj_ops@calibrated=154,842 | |||
| 100% | 99.6% | 154,842 | 154,177 |
| 90% | 89.2% | 139,358 | 138,094 |
| 80% | 79.3% | 123,874 | 122,834 |
| 70% | 70.2% | 108,390 | 108,757 |
| 60% | 59.4% | 92,905 | 91,979 |
| 50% | 49.7% | 77,421 | 76,951 |
| 40% | 40.0% | 61,937 | 61,878 |
| 30% | 30.2% | 46,453 | 46,824 |
| 20% | 19.8% | 30,968 | 30,732 |
| 10% | 9.9% | 15,484 | 15,283 |
| Active Idle | 0 | 0 | |
| Target Load | Actual Load | ssj_ops | |
|---|---|---|---|
| Target | Actual | ||
| Calibration 1 | 151,967 | ||
| Calibration 2 | 152,979 | ||
| Calibration 3 | 153,362 | ||
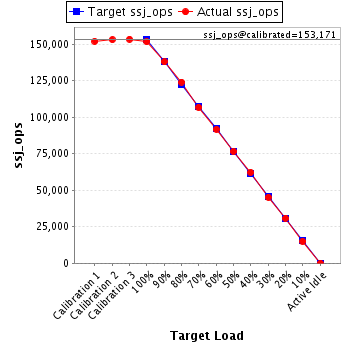
| ssj_ops@calibrated=153,171 | |||
| 100% | 99.0% | 153,171 | 151,582 |
| 90% | 90.0% | 137,854 | 137,857 |
| 80% | 81.0% | 122,537 | 124,019 |
| 70% | 69.6% | 107,220 | 106,644 |
| 60% | 59.9% | 91,903 | 91,749 |
| 50% | 50.0% | 76,585 | 76,633 |
| 40% | 40.7% | 61,268 | 62,282 |
| 30% | 29.5% | 45,951 | 45,163 |
| 20% | 20.2% | 30,634 | 30,881 |
| 10% | 9.8% | 15,317 | 15,058 |
| Active Idle | 0 | 0 | |
| Target Load | Actual Load | ssj_ops | |
|---|---|---|---|
| Target | Actual | ||
| Calibration 1 | 151,101 | ||
| Calibration 2 | 152,396 | ||
| Calibration 3 | 152,208 | ||
| ssj_ops@calibrated=152,302 | |||
| 100% | 98.5% | 152,302 | 149,962 |
| 90% | 90.2% | 137,072 | 137,325 |
| 80% | 80.7% | 121,842 | 122,970 |
| 70% | 70.4% | 106,611 | 107,154 |
| 60% | 59.8% | 91,381 | 91,018 |
| 50% | 49.9% | 76,151 | 75,934 |
| 40% | 40.4% | 60,921 | 61,471 |
| 30% | 30.3% | 45,691 | 46,145 |
| 20% | 20.0% | 30,460 | 30,473 |
| 10% | 9.8% | 15,230 | 14,912 |
| Active Idle | 0 | 0 | |

| Target Load | Actual Load | ssj_ops | |
|---|---|---|---|
| Target | Actual | ||
| Calibration 1 | 153,112 | ||
| Calibration 2 | 152,937 | ||
| Calibration 3 | 153,213 | ||
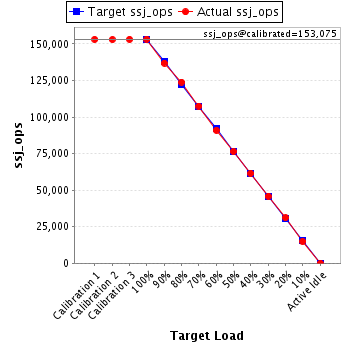
| ssj_ops@calibrated=153,075 | |||
| 100% | 100.1% | 153,075 | 153,244 |
| 90% | 89.4% | 137,767 | 136,911 |
| 80% | 81.0% | 122,460 | 123,932 |
| 70% | 70.2% | 107,152 | 107,512 |
| 60% | 59.4% | 91,845 | 90,999 |
| 50% | 50.0% | 76,537 | 76,526 |
| 40% | 40.2% | 61,230 | 61,554 |
| 30% | 30.0% | 45,922 | 45,881 |
| 20% | 20.3% | 30,615 | 31,018 |
| 10% | 9.8% | 15,307 | 15,008 |
| Active Idle | 0 | 0 | |