SPECpower_ssj2008
Host 'Node4' Performance Report
Copyright © 2007-2010 Standard Performance Evaluation Corporation
| Hewlett-Packard Company ProLiant DL170h G6 (2.93 GHz, Intel Xeon X5670 processor) | ssj_ops@100% = 856,414 ssj_ops@100% per JVM = 142,736 |
||||
| Test Sponsor: | Hewlett-Packard Company | SPEC License #: | 3 | Test Method: | Multi Node |
| Tested By: | Hewlett-Packard Company | Test Location: | Houston, TX, USA | Test Date: | Apr 15, 2010 |
| Hardware Availability: | Jun-2010 | Software Availability: | Mar-2010 | Publication: | May 13, 2010 |
| System Source: | Single Supplier | System Designation: | Server | Power Provisioning: | Line-powered |
| Target Load | Actual Load | ssj_ops | |
|---|---|---|---|
| Target | Actual | ||
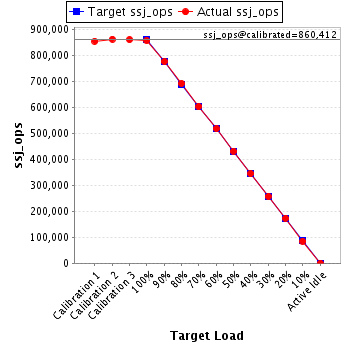
| Calibration 1 | 854,095 | ||
| Calibration 2 | 861,474 | ||
| Calibration 3 | 859,350 | ||
| ssj_ops@calibrated=860,412 | |||
| 100% | 99.5% | 860,412 | 856,414 |
| 90% | 90.1% | 774,371 | 775,410 |
| 80% | 80.3% | 688,330 | 691,327 |
| 70% | 70.0% | 602,288 | 602,405 |
| 60% | 60.1% | 516,247 | 517,351 |
| 50% | 50.1% | 430,206 | 431,488 |
| 40% | 40.0% | 344,165 | 344,418 |
| 30% | 29.9% | 258,124 | 257,141 |
| 20% | 20.2% | 172,082 | 173,671 |
| 10% | 9.9% | 86,041 | 84,908 |
| Active Idle | 0 | 0 | |
| Set Identifier: | sut |
| Set Description: | ProLiant DL4x170h G6 |
| # of Identical Nodes: | 4 |
| Comment: | System Under Test |
| Hardware | |
|---|---|
| Hardware Vendor: | Hewlett-Packard Company |
| Model: | ProLiant DL170h G6 (2.93 GHz, Intel Xeon X5670 processor) |
| Form Factor: | 1U |
| CPU Name: | Intel Xeon X5670 |
| CPU Characteristics: | Six-Core, 2.93 GHz, 12 MB L3 cache |
| CPU Frequency (MHz): | 2933 |
| CPU(s) Enabled: | 12 cores, 2 chips, 6 cores/chip |
| Hardware Threads: | 24 (2 / core) |
| CPU(s) Orderable: | 1,2 chips |
| Primary Cache: | 32 KB I + 32 KB D on chip per core |
| Secondary Cache: | 256 KB I+D on chip per core |
| Tertiary Cache: | 12 MB I+D on chip per chip |
| Other Cache: | None |
| Memory Amount (GB): | 16 |
| # and size of DIMM: | 4 x 4096 MB |
| Memory Details: | 4GB 2Rx8 PC3L-10600E; slots 1 and 4 populated on each processor |
| Power Supply Quantity and Rating (W): | None |
| Power Supply Details: | Shared |
| Disk Drive: | 1 x 60GB SSD 2.5" SATA, HP part #:572071-B21 |
| Disk Controller: | Integrated SATA |
| # and type of Network Interface Cards (NICs) Installed: | 1 x Intel(R) 82576 Gigabit Dual Port Network Connection |
| NICs Enabled in Firmware / OS / Connected: | 2/2/1 |
| Network Speed (Mbit): | 1000 |
| Keyboard: | None |
| Mouse: | None |
| Monitor: | None |
| Optical Drives: | No |
| Other Hardware: | None |
| Software | |
|---|---|
| Power Management: | Power saver enabled in OS |
| Operating System (OS): | Windows Server 2008, Enterprise Edition |
| OS Version: | R2 |
| Filesystem: | NTFS |
| JVM Vendor: | IBM Corporation |
| JVM Version: | IBM J9 VM (build 2.4, J2RE 1.6.0 IBM J9 2.4 Windows Server 2008 amd64-64 jvmwa660sr5-20090519_35743 (JIT enabled, AOT enabled) |
| JVM Command-line Options: | -Xaggressive -Xcompressedrefs -Xgcpolicy:gencon -Xmn1500m -Xms1875m -Xmx1875m -XlockReservation -Xnoloa -XtlhPrefetch -Xlp |
| JVM Affinity: | Used "start /AFFINITY [0xF, 0xF0, 0xF00, 0xF000, 0xF0000, 0xF00000] |
| JVM Instances: | 6 |
| JVM Initial Heap (MB): | 1875 |
| JVM Maximum Heap (MB): | 1875 |
| JVM Address Bits: | 64 |
| Boot Firmware Version: | 034 04/02/2010 |
| Management Firmware Version: | 4.20 1/13/10 |
| Workload Version: | SSJ 1.2.6 |
| Director Location: | Controller |
| Other Software: | None |
| JVM Instance | ssj_ops@100% |
|---|---|
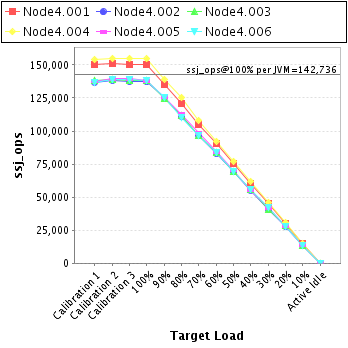
| Node4.001 | 150,516 |
| Node4.002 | 137,102 |
| Node4.003 | 137,974 |
| Node4.004 | 154,566 |
| Node4.005 | 138,153 |
| Node4.006 | 138,104 |
| ssj_ops@100% | 856,414 |
| ssj_ops@100% per JVM | 142,736 |
| Target Load | Actual Load | ssj_ops | |
|---|---|---|---|
| Target | Actual | ||
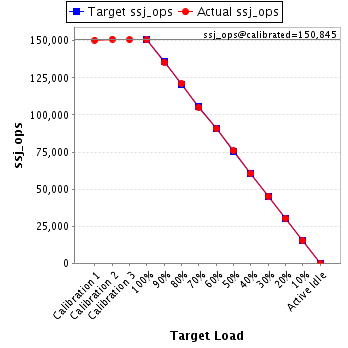
| Calibration 1 | 150,323 | ||
| Calibration 2 | 151,061 | ||
| Calibration 3 | 150,630 | ||
| ssj_ops@calibrated=150,845 | |||
| 100% | 99.8% | 150,845 | 150,516 |
| 90% | 89.8% | 135,761 | 135,534 |
| 80% | 80.2% | 120,676 | 121,022 |
| 70% | 69.8% | 105,592 | 105,244 |
| 60% | 60.2% | 90,507 | 90,855 |
| 50% | 50.2% | 75,423 | 75,772 |
| 40% | 40.1% | 60,338 | 60,467 |
| 30% | 30.0% | 45,254 | 45,233 |
| 20% | 20.0% | 30,169 | 30,147 |
| 10% | 10.1% | 15,085 | 15,274 |
| Active Idle | 0 | 0 | |
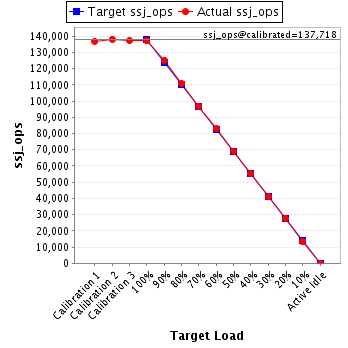
| Target Load | Actual Load | ssj_ops | |
|---|---|---|---|
| Target | Actual | ||
| Calibration 1 | 136,935 | ||
| Calibration 2 | 138,182 | ||
| Calibration 3 | 137,255 | ||
| ssj_ops@calibrated=137,718 | |||
| 100% | 99.6% | 137,718 | 137,102 |
| 90% | 90.9% | 123,946 | 125,142 |
| 80% | 80.5% | 110,175 | 110,827 |
| 70% | 70.4% | 96,403 | 96,926 |
| 60% | 60.2% | 82,631 | 82,843 |
| 50% | 50.2% | 68,859 | 69,198 |
| 40% | 40.2% | 55,087 | 55,299 |
| 30% | 29.8% | 41,315 | 41,033 |
| 20% | 20.2% | 27,544 | 27,871 |
| 10% | 9.9% | 13,772 | 13,597 |
| Active Idle | 0 | 0 | |
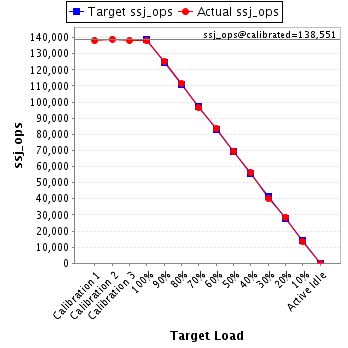
| Target Load | Actual Load | ssj_ops | |
|---|---|---|---|
| Target | Actual | ||
| Calibration 1 | 138,148 | ||
| Calibration 2 | 139,043 | ||
| Calibration 3 | 138,060 | ||
| ssj_ops@calibrated=138,551 | |||
| 100% | 99.6% | 138,551 | 137,974 |
| 90% | 90.2% | 124,696 | 124,958 |
| 80% | 80.5% | 110,841 | 111,471 |
| 70% | 69.7% | 96,986 | 96,541 |
| 60% | 60.3% | 83,131 | 83,520 |
| 50% | 50.2% | 69,276 | 69,613 |
| 40% | 40.4% | 55,421 | 56,022 |
| 30% | 29.2% | 41,565 | 40,486 |
| 20% | 20.6% | 27,710 | 28,539 |
| 10% | 9.8% | 13,855 | 13,612 |
| Active Idle | 0 | 0 | |
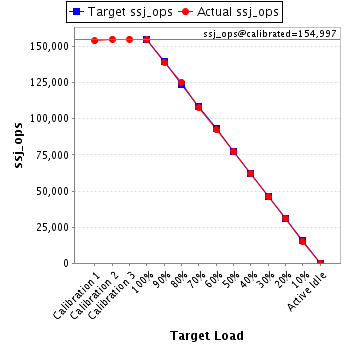
| Target Load | Actual Load | ssj_ops | |
|---|---|---|---|
| Target | Actual | ||
| Calibration 1 | 153,882 | ||
| Calibration 2 | 154,911 | ||
| Calibration 3 | 155,084 | ||
| ssj_ops@calibrated=154,997 | |||
| 100% | 99.7% | 154,997 | 154,566 |
| 90% | 89.8% | 139,498 | 139,222 |
| 80% | 80.7% | 123,998 | 125,131 |
| 70% | 69.7% | 108,498 | 108,094 |
| 60% | 59.6% | 92,998 | 92,407 |
| 50% | 49.9% | 77,499 | 77,301 |
| 40% | 40.1% | 61,999 | 62,138 |
| 30% | 29.8% | 46,499 | 46,133 |
| 20% | 20.0% | 30,999 | 31,033 |
| 10% | 9.8% | 15,500 | 15,137 |
| Active Idle | 0 | 0 | |
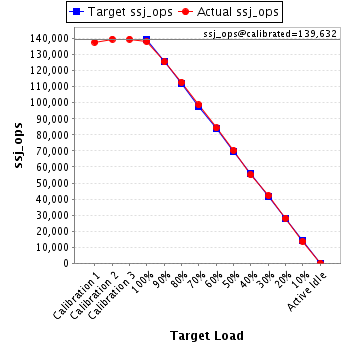
| Target Load | Actual Load | ssj_ops | |
|---|---|---|---|
| Target | Actual | ||
| Calibration 1 | 137,790 | ||
| Calibration 2 | 139,629 | ||
| Calibration 3 | 139,635 | ||
| ssj_ops@calibrated=139,632 | |||
| 100% | 98.9% | 139,632 | 138,153 |
| 90% | 89.9% | 125,669 | 125,485 |
| 80% | 80.8% | 111,706 | 112,760 |
| 70% | 70.6% | 97,742 | 98,649 |
| 60% | 60.4% | 83,779 | 84,284 |
| 50% | 50.4% | 69,816 | 70,374 |
| 40% | 39.4% | 55,853 | 55,056 |
| 30% | 30.2% | 41,890 | 42,145 |
| 20% | 20.1% | 27,926 | 28,092 |
| 10% | 9.7% | 13,963 | 13,608 |
| Active Idle | 0 | 0 | |
| Target Load | Actual Load | ssj_ops | |
|---|---|---|---|
| Target | Actual | ||
| Calibration 1 | 137,017 | ||
| Calibration 2 | 138,649 | ||
| Calibration 3 | 138,687 | ||
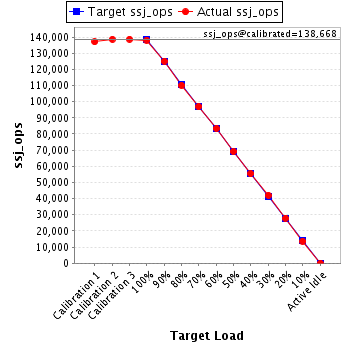
| ssj_ops@calibrated=138,668 | |||
| 100% | 99.6% | 138,668 | 138,104 |
| 90% | 90.2% | 124,801 | 125,069 |
| 80% | 79.4% | 110,934 | 110,117 |
| 70% | 69.9% | 97,068 | 96,951 |
| 60% | 60.2% | 83,201 | 83,443 |
| 50% | 49.9% | 69,334 | 69,229 |
| 40% | 40.0% | 55,467 | 55,435 |
| 30% | 30.4% | 41,600 | 42,112 |
| 20% | 20.2% | 27,734 | 27,990 |
| 10% | 9.9% | 13,867 | 13,679 |
| Active Idle | 0 | 0 | |
