SPECpower_ssj2008
Host 'Node2' Performance Report
Copyright © 2007-2010 Standard Performance Evaluation Corporation
| Hewlett-Packard Company ProLiant DL170h G6 (2.93 GHz, Intel Xeon X5670 processor) | ssj_ops@100% = 854,987 ssj_ops@100% per JVM = 142,498 |
||||
| Test Sponsor: | Hewlett-Packard Company | SPEC License #: | 3 | Test Method: | Multi Node |
| Tested By: | Hewlett-Packard Company | Test Location: | Houston, TX, USA | Test Date: | Apr 15, 2010 |
| Hardware Availability: | Jun-2010 | Software Availability: | Mar-2010 | Publication: | May 13, 2010 |
| System Source: | Single Supplier | System Designation: | Server | Power Provisioning: | Line-powered |
| Target Load | Actual Load | ssj_ops | |
|---|---|---|---|
| Target | Actual | ||
| Calibration 1 | 854,892 | ||
| Calibration 2 | 858,193 | ||
| Calibration 3 | 856,455 | ||
| ssj_ops@calibrated=857,324 | |||
| 100% | 99.7% | 857,324 | 854,987 |
| 90% | 89.8% | 771,591 | 769,858 |
| 80% | 80.2% | 685,859 | 687,694 |
| 70% | 69.9% | 600,127 | 598,952 |
| 60% | 59.9% | 514,394 | 513,233 |
| 50% | 49.9% | 428,662 | 428,184 |
| 40% | 39.9% | 342,929 | 342,108 |
| 30% | 30.4% | 257,197 | 260,868 |
| 20% | 20.0% | 171,465 | 171,087 |
| 10% | 10.0% | 85,732 | 85,621 |
| Active Idle | 0 | 0 | |

| Set Identifier: | sut |
| Set Description: | ProLiant DL4x170h G6 |
| # of Identical Nodes: | 4 |
| Comment: | System Under Test |
| Hardware | |
|---|---|
| Hardware Vendor: | Hewlett-Packard Company |
| Model: | ProLiant DL170h G6 (2.93 GHz, Intel Xeon X5670 processor) |
| Form Factor: | 1U |
| CPU Name: | Intel Xeon X5670 |
| CPU Characteristics: | Six-Core, 2.93 GHz, 12 MB L3 cache |
| CPU Frequency (MHz): | 2933 |
| CPU(s) Enabled: | 12 cores, 2 chips, 6 cores/chip |
| Hardware Threads: | 24 (2 / core) |
| CPU(s) Orderable: | 1,2 chips |
| Primary Cache: | 32 KB I + 32 KB D on chip per core |
| Secondary Cache: | 256 KB I+D on chip per core |
| Tertiary Cache: | 12 MB I+D on chip per chip |
| Other Cache: | None |
| Memory Amount (GB): | 16 |
| # and size of DIMM: | 4 x 4096 MB |
| Memory Details: | 4GB 2Rx8 PC3L-10600E; slots 1 and 4 populated on each processor |
| Power Supply Quantity and Rating (W): | None |
| Power Supply Details: | Shared |
| Disk Drive: | 1 x 60GB SSD 2.5" SATA, HP part #:572071-B21 |
| Disk Controller: | Integrated SATA |
| # and type of Network Interface Cards (NICs) Installed: | 1 x Intel(R) 82576 Gigabit Dual Port Network Connection |
| NICs Enabled in Firmware / OS / Connected: | 2/2/1 |
| Network Speed (Mbit): | 1000 |
| Keyboard: | None |
| Mouse: | None |
| Monitor: | None |
| Optical Drives: | No |
| Other Hardware: | None |
| Software | |
|---|---|
| Power Management: | Power saver enabled in OS |
| Operating System (OS): | Windows Server 2008, Enterprise Edition |
| OS Version: | R2 |
| Filesystem: | NTFS |
| JVM Vendor: | IBM Corporation |
| JVM Version: | IBM J9 VM (build 2.4, J2RE 1.6.0 IBM J9 2.4 Windows Server 2008 amd64-64 jvmwa660sr5-20090519_35743 (JIT enabled, AOT enabled) |
| JVM Command-line Options: | -Xaggressive -Xcompressedrefs -Xgcpolicy:gencon -Xmn1500m -Xms1875m -Xmx1875m -XlockReservation -Xnoloa -XtlhPrefetch -Xlp |
| JVM Affinity: | Used "start /AFFINITY [0xF, 0xF0, 0xF00, 0xF000, 0xF0000, 0xF00000] |
| JVM Instances: | 6 |
| JVM Initial Heap (MB): | 1875 |
| JVM Maximum Heap (MB): | 1875 |
| JVM Address Bits: | 64 |
| Boot Firmware Version: | 034 04/02/2010 |
| Management Firmware Version: | 4.20 1/13/10 |
| Workload Version: | SSJ 1.2.6 |
| Director Location: | Controller |
| Other Software: | None |
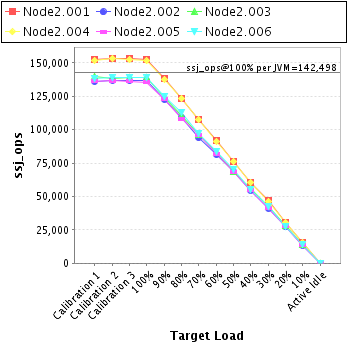
| JVM Instance | ssj_ops@100% |
|---|---|
| Node2.001 | 152,845 |
| Node2.002 | 136,624 |
| Node2.003 | 139,138 |
| Node2.004 | 151,450 |
| Node2.005 | 135,659 |
| Node2.006 | 139,271 |
| ssj_ops@100% | 854,987 |
| ssj_ops@100% per JVM | 142,498 |
| Target Load | Actual Load | ssj_ops | |
|---|---|---|---|
| Target | Actual | ||
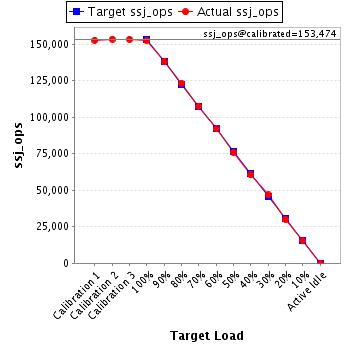
| Calibration 1 | 152,764 | ||
| Calibration 2 | 153,495 | ||
| Calibration 3 | 153,452 | ||
| ssj_ops@calibrated=153,474 | |||
| 100% | 99.6% | 153,474 | 152,845 |
| 90% | 89.9% | 138,126 | 137,924 |
| 80% | 80.4% | 122,779 | 123,355 |
| 70% | 70.2% | 107,431 | 107,688 |
| 60% | 59.9% | 92,084 | 91,988 |
| 50% | 49.6% | 76,737 | 76,124 |
| 40% | 39.5% | 61,389 | 60,602 |
| 30% | 30.5% | 46,042 | 46,863 |
| 20% | 19.7% | 30,695 | 30,212 |
| 10% | 10.0% | 15,347 | 15,366 |
| Active Idle | 0 | 0 | |
| Target Load | Actual Load | ssj_ops | |
|---|---|---|---|
| Target | Actual | ||
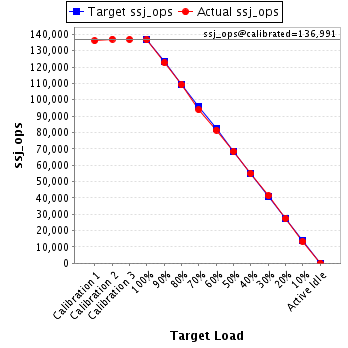
| Calibration 1 | 136,118 | ||
| Calibration 2 | 137,077 | ||
| Calibration 3 | 136,905 | ||
| ssj_ops@calibrated=136,991 | |||
| 100% | 99.7% | 136,991 | 136,624 |
| 90% | 89.6% | 123,292 | 122,708 |
| 80% | 79.7% | 109,593 | 109,136 |
| 70% | 68.6% | 95,894 | 93,918 |
| 60% | 59.4% | 82,195 | 81,434 |
| 50% | 49.9% | 68,496 | 68,340 |
| 40% | 40.0% | 54,796 | 54,827 |
| 30% | 30.1% | 41,097 | 41,270 |
| 20% | 20.0% | 27,398 | 27,372 |
| 10% | 9.7% | 13,699 | 13,296 |
| Active Idle | 0 | 0 | |
| Target Load | Actual Load | ssj_ops | |
|---|---|---|---|
| Target | Actual | ||
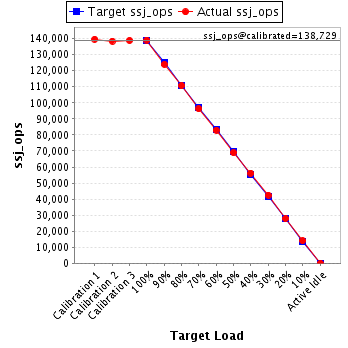
| Calibration 1 | 139,678 | ||
| Calibration 2 | 138,521 | ||
| Calibration 3 | 138,937 | ||
| ssj_ops@calibrated=138,729 | |||
| 100% | 100.3% | 138,729 | 139,138 |
| 90% | 89.4% | 124,856 | 124,049 |
| 80% | 79.8% | 110,983 | 110,686 |
| 70% | 69.4% | 97,110 | 96,281 |
| 60% | 59.8% | 83,237 | 83,004 |
| 50% | 49.7% | 69,364 | 68,889 |
| 40% | 40.5% | 55,491 | 56,249 |
| 30% | 30.6% | 41,619 | 42,519 |
| 20% | 20.1% | 27,746 | 27,913 |
| 10% | 10.1% | 13,873 | 14,029 |
| Active Idle | 0 | 0 | |
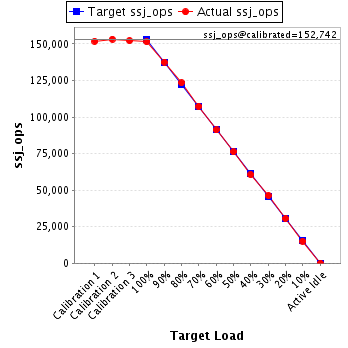
| Target Load | Actual Load | ssj_ops | |
|---|---|---|---|
| Target | Actual | ||
| Calibration 1 | 151,911 | ||
| Calibration 2 | 153,303 | ||
| Calibration 3 | 152,182 | ||
| ssj_ops@calibrated=152,742 | |||
| 100% | 99.2% | 152,742 | 151,450 |
| 90% | 90.1% | 137,468 | 137,641 |
| 80% | 80.8% | 122,194 | 123,395 |
| 70% | 70.3% | 106,920 | 107,365 |
| 60% | 59.7% | 91,645 | 91,203 |
| 50% | 49.9% | 76,371 | 76,185 |
| 40% | 39.6% | 61,097 | 60,540 |
| 30% | 30.3% | 45,823 | 46,275 |
| 20% | 20.1% | 30,548 | 30,646 |
| 10% | 9.9% | 15,274 | 15,172 |
| Active Idle | 0 | 0 | |
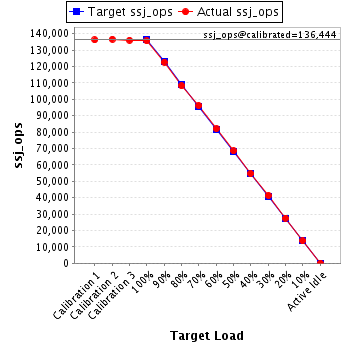
| Target Load | Actual Load | ssj_ops | |
|---|---|---|---|
| Target | Actual | ||
| Calibration 1 | 136,252 | ||
| Calibration 2 | 136,723 | ||
| Calibration 3 | 136,165 | ||
| ssj_ops@calibrated=136,444 | |||
| 100% | 99.4% | 136,444 | 135,659 |
| 90% | 90.0% | 122,799 | 122,787 |
| 80% | 79.3% | 109,155 | 108,211 |
| 70% | 70.5% | 95,511 | 96,249 |
| 60% | 60.1% | 81,866 | 82,036 |
| 50% | 50.2% | 68,222 | 68,503 |
| 40% | 40.1% | 54,578 | 54,652 |
| 30% | 30.3% | 40,933 | 41,359 |
| 20% | 20.2% | 27,289 | 27,600 |
| 10% | 10.0% | 13,644 | 13,650 |
| Active Idle | 0 | 0 | |
| Target Load | Actual Load | ssj_ops | |
|---|---|---|---|
| Target | Actual | ||
| Calibration 1 | 138,168 | ||
| Calibration 2 | 139,074 | ||
| Calibration 3 | 138,815 | ||
| ssj_ops@calibrated=138,944 | |||
| 100% | 100.2% | 138,944 | 139,271 |
| 90% | 89.8% | 125,050 | 124,750 |
| 80% | 81.3% | 111,155 | 112,910 |
| 70% | 70.1% | 97,261 | 97,451 |
| 60% | 60.1% | 83,366 | 83,568 |
| 50% | 50.5% | 69,472 | 70,144 |
| 40% | 39.8% | 55,578 | 55,238 |
| 30% | 30.6% | 41,683 | 42,582 |
| 20% | 19.7% | 27,789 | 27,346 |
| 10% | 10.2% | 13,894 | 14,108 |
| Active Idle | 0 | 0 | |
