
SPECpower_ssj2008
Host 'Node4' Performance Report
Copyright © 2007-2010 Standard Performance Evaluation Corporation
| Hewlett-Packard Company ProLiant DL170h G6 (2.93 GHz, Intel Xeon X5670 processor) | ssj_ops@100% = 861,632 ssj_ops@100% per JVM = 143,605 |
||||
| Test Sponsor: | Hewlett-Packard Company | SPEC License #: | 3 | Test Method: | Multi Node |
| Tested By: | Hewlett-Packard Company | Test Location: | Houston, TX, USA | Test Date: | Apr 5, 2010 |
| Hardware Availability: | Jun-2010 | Software Availability: | Sep-2009 | Publication: | Apr 21, 2010 |
| System Source: | Single Supplier | System Designation: | Server | Power Provisioning: | Line-powered |
| Target Load | Actual Load | ssj_ops | |
|---|---|---|---|
| Target | Actual | ||
| Calibration 1 | 861,889 | ||
| Calibration 2 | 865,755 | ||
| Calibration 3 | 862,203 | ||
| ssj_ops@calibrated=863,979 | |||
| 100% | 99.7% | 863,979 | 861,632 |
| 90% | 90.2% | 777,582 | 779,160 |
| 80% | 79.9% | 691,184 | 690,080 |
| 70% | 69.6% | 604,786 | 601,629 |
| 60% | 60.1% | 518,388 | 518,828 |
| 50% | 49.8% | 431,990 | 430,160 |
| 40% | 40.0% | 345,592 | 345,352 |
| 30% | 30.0% | 259,194 | 258,792 |
| 20% | 19.9% | 172,796 | 172,314 |
| 10% | 10.1% | 86,398 | 86,900 |
| Active Idle | 0 | 0 | |

| Set Identifier: | sut |
| Set Description: | ProLiant DL4x170h G6 |
| # of Identical Nodes: | 4 |
| Comment: | System Under Test |
| Hardware | |
|---|---|
| Hardware Vendor: | Hewlett-Packard Company |
| Model: | ProLiant DL170h G6 (2.93 GHz, Intel Xeon X5670 processor) |
| Form Factor: | 1U |
| CPU Name: | Intel Xeon X5670 |
| CPU Characteristics: | Six-Core, 2.93 GHz, 12 MB L3 cache |
| CPU Frequency (MHz): | 2933 |
| CPU(s) Enabled: | 12 cores, 2 chips, 6 cores/chip |
| Hardware Threads: | 24 (2 / core) |
| CPU(s) Orderable: | 1,2 chips |
| Primary Cache: | 32 KB I + 32 KB D on chip per core |
| Secondary Cache: | 256 KB I+D on chip per core |
| Tertiary Cache: | 12 MB I+D on chip per chip |
| Other Cache: | None |
| Memory Amount (GB): | 16 |
| # and size of DIMM: | 4 x 4096 MB |
| Memory Details: | 4GB 2Rx8 PC3-10600E; slots 1 and 4 populated on each processor |
| Power Supply Quantity and Rating (W): | None |
| Power Supply Details: | Shared |
| Disk Drive: | 1 x 60GB SSD 2.5" SATA, HP part #:572071-B21 |
| Disk Controller: | Integrated SATA |
| # and type of Network Interface Cards (NICs) Installed: | 1 x Intel(R) 82576 Gigabit Dual Port Network Connection |
| NICs Enabled in Firmware / OS / Connected: | 2/2/1 |
| Network Speed (Mbit): | 1000 |
| Keyboard: | None |
| Mouse: | None |
| Monitor: | None |
| Optical Drives: | No |
| Other Hardware: | None |
| Software | |
|---|---|
| Power Management: | Power saver enabled in OS |
| Operating System (OS): | Windows Server 2008, Enterprise Edition |
| OS Version: | R2 |
| Filesystem: | NTFS |
| JVM Vendor: | IBM Corporation |
| JVM Version: | IBM J9 VM (build 2.4, J2RE 1.6.0 IBM J9 2.4 Windows Server 2008 amd64-64 jvmwa660sr5-20090519_35743 (JIT enabled, AOT enabled) |
| JVM Command-line Options: | -Xaggressive -Xcompressedrefs -Xgcpolicy:gencon -Xmn1500m -Xms1875m -Xmx1875m -XlockReservation -Xnoloa -XtlhPrefetch -Xlp |
| JVM Affinity: | Used "start /AFFINITY [0xF, 0xF0, 0xF00, 0xF000, 0xF0000, 0xF00000] |
| JVM Instances: | 6 |
| JVM Initial Heap (MB): | 1875 |
| JVM Maximum Heap (MB): | 1875 |
| JVM Address Bits: | 64 |
| Boot Firmware Version: | 034 04/02/2010 |
| Management Firmware Version: | 4.20 1/13/10 |
| Workload Version: | SSJ 1.2.6 |
| Director Location: | Controller |
| Other Software: | None |
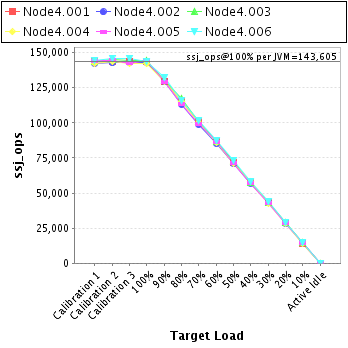
| JVM Instance | ssj_ops@100% |
|---|---|
| Node4.001 | 143,611 |
| Node4.002 | 143,224 |
| Node4.003 | 144,356 |
| Node4.004 | 141,917 |
| Node4.005 | 144,524 |
| Node4.006 | 144,000 |
| ssj_ops@100% | 861,632 |
| ssj_ops@100% per JVM | 143,605 |
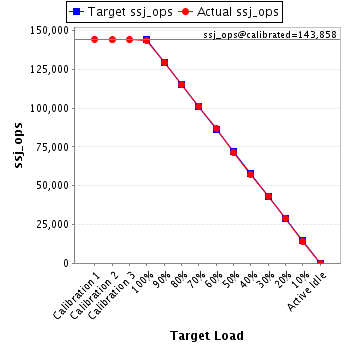
| Target Load | Actual Load | ssj_ops | |
|---|---|---|---|
| Target | Actual | ||
| Calibration 1 | 144,360 | ||
| Calibration 2 | 143,837 | ||
| Calibration 3 | 143,878 | ||
| ssj_ops@calibrated=143,858 | |||
| 100% | 99.8% | 143,858 | 143,611 |
| 90% | 89.9% | 129,472 | 129,399 |
| 80% | 80.0% | 115,086 | 115,080 |
| 70% | 70.3% | 100,700 | 101,159 |
| 60% | 60.4% | 86,315 | 86,879 |
| 50% | 49.7% | 71,929 | 71,529 |
| 40% | 39.9% | 57,543 | 57,383 |
| 30% | 30.1% | 43,157 | 43,324 |
| 20% | 20.0% | 28,772 | 28,716 |
| 10% | 9.9% | 14,386 | 14,195 |
| Active Idle | 0 | 0 | |
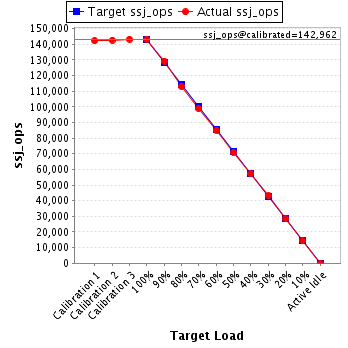
| Target Load | Actual Load | ssj_ops | |
|---|---|---|---|
| Target | Actual | ||
| Calibration 1 | 142,240 | ||
| Calibration 2 | 142,654 | ||
| Calibration 3 | 143,269 | ||
| ssj_ops@calibrated=142,962 | |||
| 100% | 100.2% | 142,962 | 143,224 |
| 90% | 90.3% | 128,666 | 129,142 |
| 80% | 79.1% | 114,369 | 113,034 |
| 70% | 69.2% | 100,073 | 98,859 |
| 60% | 59.6% | 85,777 | 85,187 |
| 50% | 49.5% | 71,481 | 70,718 |
| 40% | 40.0% | 57,185 | 57,131 |
| 30% | 30.1% | 42,889 | 43,070 |
| 20% | 19.8% | 28,592 | 28,316 |
| 10% | 10.2% | 14,296 | 14,534 |
| Active Idle | 0 | 0 | |
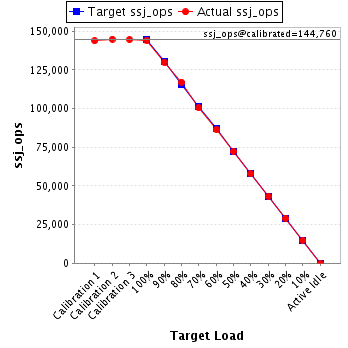
| Target Load | Actual Load | ssj_ops | |
|---|---|---|---|
| Target | Actual | ||
| Calibration 1 | 143,774 | ||
| Calibration 2 | 144,917 | ||
| Calibration 3 | 144,603 | ||
| ssj_ops@calibrated=144,760 | |||
| 100% | 99.7% | 144,760 | 144,356 |
| 90% | 89.9% | 130,284 | 130,149 |
| 80% | 80.9% | 115,808 | 117,121 |
| 70% | 69.5% | 101,332 | 100,664 |
| 60% | 59.8% | 86,856 | 86,534 |
| 50% | 49.9% | 72,380 | 72,306 |
| 40% | 39.9% | 57,904 | 57,800 |
| 30% | 30.0% | 43,428 | 43,480 |
| 20% | 20.1% | 28,952 | 29,089 |
| 10% | 10.3% | 14,476 | 14,873 |
| Active Idle | 0 | 0 | |
| Target Load | Actual Load | ssj_ops | |
|---|---|---|---|
| Target | Actual | ||
| Calibration 1 | 142,558 | ||
| Calibration 2 | 143,548 | ||
| Calibration 3 | 142,224 | ||
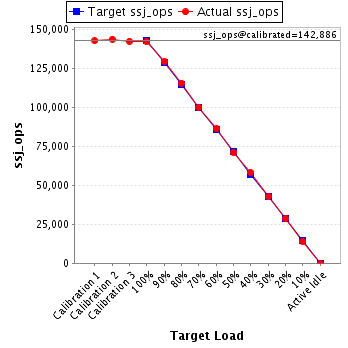
| ssj_ops@calibrated=142,886 | |||
| 100% | 99.3% | 142,886 | 141,917 |
| 90% | 90.4% | 128,598 | 129,222 |
| 80% | 80.8% | 114,309 | 115,454 |
| 70% | 69.9% | 100,020 | 99,942 |
| 60% | 60.4% | 85,732 | 86,263 |
| 50% | 49.8% | 71,443 | 71,116 |
| 40% | 40.7% | 57,155 | 58,177 |
| 30% | 29.8% | 42,866 | 42,570 |
| 20% | 19.9% | 28,577 | 28,474 |
| 10% | 9.9% | 14,289 | 14,205 |
| Active Idle | 0 | 0 | |
| Target Load | Actual Load | ssj_ops | |
|---|---|---|---|
| Target | Actual | ||
| Calibration 1 | 144,285 | ||
| Calibration 2 | 144,740 | ||
| Calibration 3 | 142,297 | ||
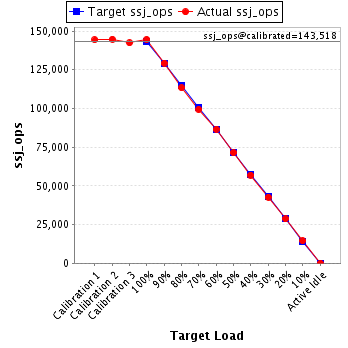
| ssj_ops@calibrated=143,518 | |||
| 100% | 100.7% | 143,518 | 144,524 |
| 90% | 90.1% | 129,166 | 129,296 |
| 80% | 78.9% | 114,815 | 113,271 |
| 70% | 69.3% | 100,463 | 99,393 |
| 60% | 60.4% | 86,111 | 86,628 |
| 50% | 49.7% | 71,759 | 71,382 |
| 40% | 39.7% | 57,407 | 56,932 |
| 30% | 29.8% | 43,055 | 42,704 |
| 20% | 19.9% | 28,704 | 28,619 |
| 10% | 10.1% | 14,352 | 14,451 |
| Active Idle | 0 | 0 | |
| Target Load | Actual Load | ssj_ops | |
|---|---|---|---|
| Target | Actual | ||
| Calibration 1 | 144,671 | ||
| Calibration 2 | 146,059 | ||
| Calibration 3 | 145,932 | ||
| ssj_ops@calibrated=145,996 | |||
| 100% | 98.6% | 145,996 | 144,000 |
| 90% | 90.4% | 131,396 | 131,951 |
| 80% | 79.5% | 116,797 | 116,119 |
| 70% | 69.6% | 102,197 | 101,611 |
| 60% | 59.8% | 87,597 | 87,336 |
| 50% | 50.1% | 72,998 | 73,109 |
| 40% | 39.7% | 58,398 | 57,930 |
| 30% | 29.9% | 43,799 | 43,644 |
| 20% | 19.9% | 29,199 | 29,099 |
| 10% | 10.0% | 14,600 | 14,641 |
| Active Idle | 0 | 0 | |
