SPECpower_ssj2008
Host 'Node3' Performance Report
Copyright © 2007-2010 Standard Performance Evaluation Corporation
| Hewlett-Packard Company ProLiant DL170h G6 (2.93 GHz, Intel Xeon X5670 processor) | ssj_ops@100% = 859,084 ssj_ops@100% per JVM = 143,181 |
||||
| Test Sponsor: | Hewlett-Packard Company | SPEC License #: | 3 | Test Method: | Multi Node |
| Tested By: | Hewlett-Packard Company | Test Location: | Houston, TX, USA | Test Date: | Apr 5, 2010 |
| Hardware Availability: | Jun-2010 | Software Availability: | Sep-2009 | Publication: | Apr 21, 2010 |
| System Source: | Single Supplier | System Designation: | Server | Power Provisioning: | Line-powered |
| Target Load | Actual Load | ssj_ops | |
|---|---|---|---|
| Target | Actual | ||
| Calibration 1 | 866,203 | ||
| Calibration 2 | 867,416 | ||
| Calibration 3 | 859,694 | ||
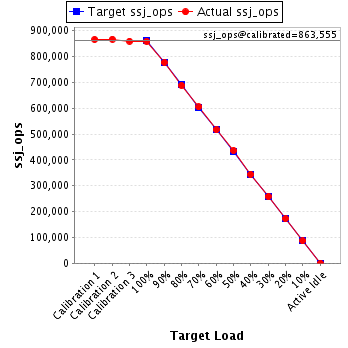
| ssj_ops@calibrated=863,555 | |||
| 100% | 99.5% | 863,555 | 859,084 |
| 90% | 90.1% | 777,200 | 777,652 |
| 80% | 79.7% | 690,844 | 688,200 |
| 70% | 70.0% | 604,489 | 604,876 |
| 60% | 59.9% | 518,133 | 516,935 |
| 50% | 50.6% | 431,778 | 436,674 |
| 40% | 39.8% | 345,422 | 343,933 |
| 30% | 30.0% | 259,067 | 258,658 |
| 20% | 19.9% | 172,711 | 172,154 |
| 10% | 10.0% | 86,356 | 86,715 |
| Active Idle | 0 | 0 | |
| Set Identifier: | sut |
| Set Description: | ProLiant DL4x170h G6 |
| # of Identical Nodes: | 4 |
| Comment: | System Under Test |
| Hardware | |
|---|---|
| Hardware Vendor: | Hewlett-Packard Company |
| Model: | ProLiant DL170h G6 (2.93 GHz, Intel Xeon X5670 processor) |
| Form Factor: | 1U |
| CPU Name: | Intel Xeon X5670 |
| CPU Characteristics: | Six-Core, 2.93 GHz, 12 MB L3 cache |
| CPU Frequency (MHz): | 2933 |
| CPU(s) Enabled: | 12 cores, 2 chips, 6 cores/chip |
| Hardware Threads: | 24 (2 / core) |
| CPU(s) Orderable: | 1,2 chips |
| Primary Cache: | 32 KB I + 32 KB D on chip per core |
| Secondary Cache: | 256 KB I+D on chip per core |
| Tertiary Cache: | 12 MB I+D on chip per chip |
| Other Cache: | None |
| Memory Amount (GB): | 16 |
| # and size of DIMM: | 4 x 4096 MB |
| Memory Details: | 4GB 2Rx8 PC3-10600E; slots 1 and 4 populated on each processor |
| Power Supply Quantity and Rating (W): | None |
| Power Supply Details: | Shared |
| Disk Drive: | 1 x 60GB SSD 2.5" SATA, HP part #:572071-B21 |
| Disk Controller: | Integrated SATA |
| # and type of Network Interface Cards (NICs) Installed: | 1 x Intel(R) 82576 Gigabit Dual Port Network Connection |
| NICs Enabled in Firmware / OS / Connected: | 2/2/1 |
| Network Speed (Mbit): | 1000 |
| Keyboard: | None |
| Mouse: | None |
| Monitor: | None |
| Optical Drives: | No |
| Other Hardware: | None |
| Software | |
|---|---|
| Power Management: | Power saver enabled in OS |
| Operating System (OS): | Windows Server 2008, Enterprise Edition |
| OS Version: | R2 |
| Filesystem: | NTFS |
| JVM Vendor: | IBM Corporation |
| JVM Version: | IBM J9 VM (build 2.4, J2RE 1.6.0 IBM J9 2.4 Windows Server 2008 amd64-64 jvmwa660sr5-20090519_35743 (JIT enabled, AOT enabled) |
| JVM Command-line Options: | -Xaggressive -Xcompressedrefs -Xgcpolicy:gencon -Xmn1500m -Xms1875m -Xmx1875m -XlockReservation -Xnoloa -XtlhPrefetch -Xlp |
| JVM Affinity: | Used "start /AFFINITY [0xF, 0xF0, 0xF00, 0xF000, 0xF0000, 0xF00000] |
| JVM Instances: | 6 |
| JVM Initial Heap (MB): | 1875 |
| JVM Maximum Heap (MB): | 1875 |
| JVM Address Bits: | 64 |
| Boot Firmware Version: | 034 04/02/2010 |
| Management Firmware Version: | 4.20 1/13/10 |
| Workload Version: | SSJ 1.2.6 |
| Director Location: | Controller |
| Other Software: | None |
| JVM Instance | ssj_ops@100% |
|---|---|
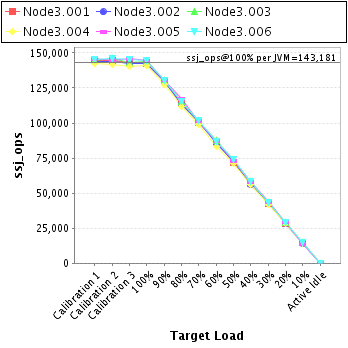
| Node3.001 | 142,762 |
| Node3.002 | 142,213 |
| Node3.003 | 144,121 |
| Node3.004 | 140,704 |
| Node3.005 | 144,431 |
| Node3.006 | 144,853 |
| ssj_ops@100% | 859,084 |
| ssj_ops@100% per JVM | 143,181 |
| Target Load | Actual Load | ssj_ops | |
|---|---|---|---|
| Target | Actual | ||
| Calibration 1 | 144,650 | ||
| Calibration 2 | 144,651 | ||
| Calibration 3 | 143,059 | ||
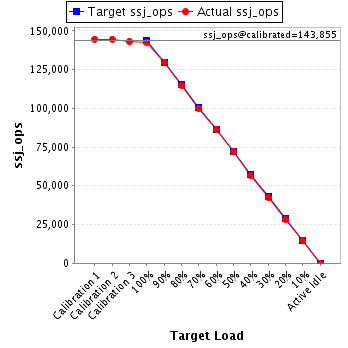
| ssj_ops@calibrated=143,855 | |||
| 100% | 99.2% | 143,855 | 142,762 |
| 90% | 90.2% | 129,469 | 129,766 |
| 80% | 79.8% | 115,084 | 114,852 |
| 70% | 69.5% | 100,698 | 100,027 |
| 60% | 60.2% | 86,313 | 86,616 |
| 50% | 50.2% | 71,927 | 72,208 |
| 40% | 39.6% | 57,542 | 56,945 |
| 30% | 29.7% | 43,156 | 42,767 |
| 20% | 19.8% | 28,771 | 28,516 |
| 10% | 10.3% | 14,385 | 14,866 |
| Active Idle | 0 | 0 | |
| Target Load | Actual Load | ssj_ops | |
|---|---|---|---|
| Target | Actual | ||
| Calibration 1 | 143,617 | ||
| Calibration 2 | 144,122 | ||
| Calibration 3 | 142,327 | ||
| ssj_ops@calibrated=143,225 | |||
| 100% | 99.3% | 143,225 | 142,213 |
| 90% | 90.3% | 128,902 | 129,269 |
| 80% | 79.3% | 114,580 | 113,531 |
| 70% | 70.8% | 100,257 | 101,345 |
| 60% | 59.6% | 85,935 | 85,373 |
| 50% | 50.8% | 71,612 | 72,753 |
| 40% | 39.2% | 57,290 | 56,208 |
| 30% | 30.5% | 42,967 | 43,639 |
| 20% | 20.0% | 28,645 | 28,645 |
| 10% | 10.1% | 14,322 | 14,395 |
| Active Idle | 0 | 0 | |

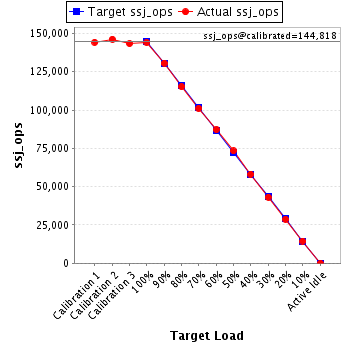
| Target Load | Actual Load | ssj_ops | |
|---|---|---|---|
| Target | Actual | ||
| Calibration 1 | 144,248 | ||
| Calibration 2 | 146,245 | ||
| Calibration 3 | 143,392 | ||
| ssj_ops@calibrated=144,818 | |||
| 100% | 99.5% | 144,818 | 144,121 |
| 90% | 90.2% | 130,336 | 130,572 |
| 80% | 79.5% | 115,855 | 115,173 |
| 70% | 69.8% | 101,373 | 101,121 |
| 60% | 60.3% | 86,891 | 87,302 |
| 50% | 50.6% | 72,409 | 73,271 |
| 40% | 40.2% | 57,927 | 58,174 |
| 30% | 29.8% | 43,445 | 43,150 |
| 20% | 19.9% | 28,964 | 28,766 |
| 10% | 10.0% | 14,482 | 14,500 |
| Active Idle | 0 | 0 | |
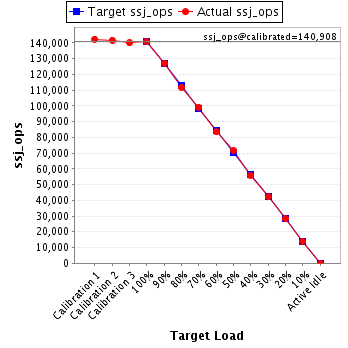
| Target Load | Actual Load | ssj_ops | |
|---|---|---|---|
| Target | Actual | ||
| Calibration 1 | 142,418 | ||
| Calibration 2 | 141,796 | ||
| Calibration 3 | 140,020 | ||
| ssj_ops@calibrated=140,908 | |||
| 100% | 99.9% | 140,908 | 140,704 |
| 90% | 90.2% | 126,817 | 127,162 |
| 80% | 79.4% | 112,726 | 111,838 |
| 70% | 70.3% | 98,636 | 99,128 |
| 60% | 59.2% | 84,545 | 83,467 |
| 50% | 50.7% | 70,454 | 71,477 |
| 40% | 39.7% | 56,363 | 55,917 |
| 30% | 29.9% | 42,272 | 42,115 |
| 20% | 20.0% | 28,182 | 28,229 |
| 10% | 10.0% | 14,091 | 14,104 |
| Active Idle | 0 | 0 | |
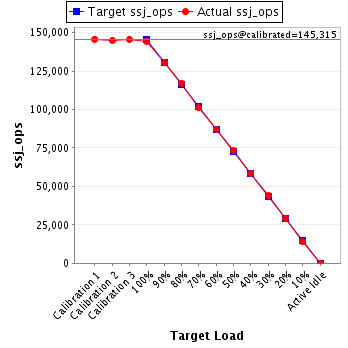
| Target Load | Actual Load | ssj_ops | |
|---|---|---|---|
| Target | Actual | ||
| Calibration 1 | 145,747 | ||
| Calibration 2 | 144,919 | ||
| Calibration 3 | 145,710 | ||
| ssj_ops@calibrated=145,315 | |||
| 100% | 99.4% | 145,315 | 144,431 |
| 90% | 89.7% | 130,783 | 130,394 |
| 80% | 80.6% | 116,252 | 117,156 |
| 70% | 69.6% | 101,720 | 101,205 |
| 60% | 59.9% | 87,189 | 87,081 |
| 50% | 50.3% | 72,657 | 73,092 |
| 40% | 40.0% | 58,126 | 58,193 |
| 30% | 30.2% | 43,594 | 43,877 |
| 20% | 20.1% | 29,063 | 29,159 |
| 10% | 9.7% | 14,531 | 14,041 |
| Active Idle | 0 | 0 | |
| Target Load | Actual Load | ssj_ops | |
|---|---|---|---|
| Target | Actual | ||
| Calibration 1 | 145,524 | ||
| Calibration 2 | 145,684 | ||
| Calibration 3 | 145,186 | ||
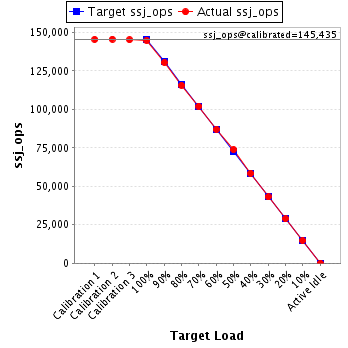
| ssj_ops@calibrated=145,435 | |||
| 100% | 99.6% | 145,435 | 144,853 |
| 90% | 89.7% | 130,892 | 130,489 |
| 80% | 79.5% | 116,348 | 115,650 |
| 70% | 70.2% | 101,805 | 102,050 |
| 60% | 59.9% | 87,261 | 87,096 |
| 50% | 50.8% | 72,718 | 73,873 |
| 40% | 40.2% | 58,174 | 58,496 |
| 30% | 29.6% | 43,631 | 43,110 |
| 20% | 19.8% | 29,087 | 28,838 |
| 10% | 10.2% | 14,544 | 14,808 |
| Active Idle | 0 | 0 | |