SPECpower_ssj2008
Host 'Node2' Performance Report
Copyright © 2007-2010 Standard Performance Evaluation Corporation
| Hewlett-Packard Company ProLiant DL170h G6 (2.93 GHz, Intel Xeon X5670 processor) | ssj_ops@100% = 858,593 ssj_ops@100% per JVM = 143,099 |
||||
| Test Sponsor: | Hewlett-Packard Company | SPEC License #: | 3 | Test Method: | Multi Node |
| Tested By: | Hewlett-Packard Company | Test Location: | Houston, TX, USA | Test Date: | Apr 5, 2010 |
| Hardware Availability: | Jun-2010 | Software Availability: | Sep-2009 | Publication: | Apr 21, 2010 |
| System Source: | Single Supplier | System Designation: | Server | Power Provisioning: | Line-powered |
| Target Load | Actual Load | ssj_ops | |
|---|---|---|---|
| Target | Actual | ||
| Calibration 1 | 862,334 | ||
| Calibration 2 | 864,533 | ||
| Calibration 3 | 866,394 | ||
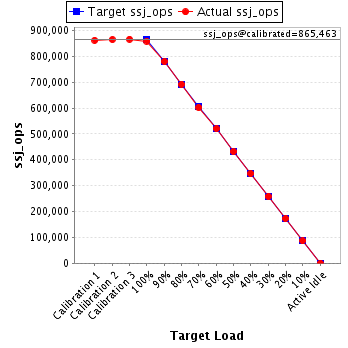
| ssj_ops@calibrated=865,463 | |||
| 100% | 99.2% | 865,463 | 858,593 |
| 90% | 90.1% | 778,917 | 780,192 |
| 80% | 80.0% | 692,371 | 691,978 |
| 70% | 69.6% | 605,824 | 602,003 |
| 60% | 60.1% | 519,278 | 520,327 |
| 50% | 49.9% | 432,732 | 432,054 |
| 40% | 40.0% | 346,185 | 346,593 |
| 30% | 29.9% | 259,639 | 258,417 |
| 20% | 20.0% | 173,093 | 173,206 |
| 10% | 10.0% | 86,546 | 86,702 |
| Active Idle | 0 | 0 | |
| Set Identifier: | sut |
| Set Description: | ProLiant DL4x170h G6 |
| # of Identical Nodes: | 4 |
| Comment: | System Under Test |
| Hardware | |
|---|---|
| Hardware Vendor: | Hewlett-Packard Company |
| Model: | ProLiant DL170h G6 (2.93 GHz, Intel Xeon X5670 processor) |
| Form Factor: | 1U |
| CPU Name: | Intel Xeon X5670 |
| CPU Characteristics: | Six-Core, 2.93 GHz, 12 MB L3 cache |
| CPU Frequency (MHz): | 2933 |
| CPU(s) Enabled: | 12 cores, 2 chips, 6 cores/chip |
| Hardware Threads: | 24 (2 / core) |
| CPU(s) Orderable: | 1,2 chips |
| Primary Cache: | 32 KB I + 32 KB D on chip per core |
| Secondary Cache: | 256 KB I+D on chip per core |
| Tertiary Cache: | 12 MB I+D on chip per chip |
| Other Cache: | None |
| Memory Amount (GB): | 16 |
| # and size of DIMM: | 4 x 4096 MB |
| Memory Details: | 4GB 2Rx8 PC3-10600E; slots 1 and 4 populated on each processor |
| Power Supply Quantity and Rating (W): | None |
| Power Supply Details: | Shared |
| Disk Drive: | 1 x 60GB SSD 2.5" SATA, HP part #:572071-B21 |
| Disk Controller: | Integrated SATA |
| # and type of Network Interface Cards (NICs) Installed: | 1 x Intel(R) 82576 Gigabit Dual Port Network Connection |
| NICs Enabled in Firmware / OS / Connected: | 2/2/1 |
| Network Speed (Mbit): | 1000 |
| Keyboard: | None |
| Mouse: | None |
| Monitor: | None |
| Optical Drives: | No |
| Other Hardware: | None |
| Software | |
|---|---|
| Power Management: | Power saver enabled in OS |
| Operating System (OS): | Windows Server 2008, Enterprise Edition |
| OS Version: | R2 |
| Filesystem: | NTFS |
| JVM Vendor: | IBM Corporation |
| JVM Version: | IBM J9 VM (build 2.4, J2RE 1.6.0 IBM J9 2.4 Windows Server 2008 amd64-64 jvmwa660sr5-20090519_35743 (JIT enabled, AOT enabled) |
| JVM Command-line Options: | -Xaggressive -Xcompressedrefs -Xgcpolicy:gencon -Xmn1500m -Xms1875m -Xmx1875m -XlockReservation -Xnoloa -XtlhPrefetch -Xlp |
| JVM Affinity: | Used "start /AFFINITY [0xF, 0xF0, 0xF00, 0xF000, 0xF0000, 0xF00000] |
| JVM Instances: | 6 |
| JVM Initial Heap (MB): | 1875 |
| JVM Maximum Heap (MB): | 1875 |
| JVM Address Bits: | 64 |
| Boot Firmware Version: | 034 04/02/2010 |
| Management Firmware Version: | 4.20 1/13/10 |
| Workload Version: | SSJ 1.2.6 |
| Director Location: | Controller |
| Other Software: | None |
| JVM Instance | ssj_ops@100% |
|---|---|
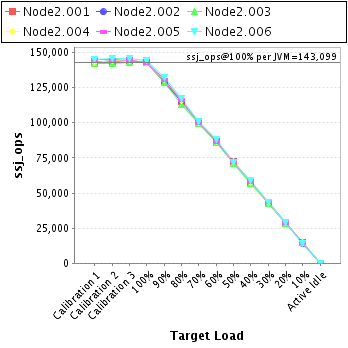
| Node2.001 | 143,220 |
| Node2.002 | 143,065 |
| Node2.003 | 142,586 |
| Node2.004 | 142,872 |
| Node2.005 | 142,831 |
| Node2.006 | 144,020 |
| ssj_ops@100% | 858,593 |
| ssj_ops@100% per JVM | 143,099 |
| Target Load | Actual Load | ssj_ops | |
|---|---|---|---|
| Target | Actual | ||
| Calibration 1 | 143,811 | ||
| Calibration 2 | 143,853 | ||
| Calibration 3 | 144,302 | ||
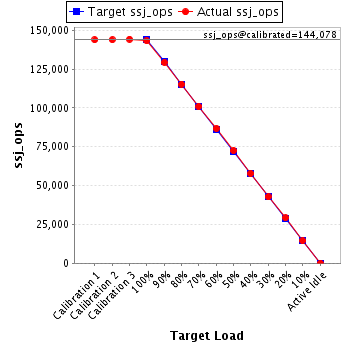
| ssj_ops@calibrated=144,078 | |||
| 100% | 99.4% | 144,078 | 143,220 |
| 90% | 89.8% | 129,670 | 129,331 |
| 80% | 80.1% | 115,262 | 115,371 |
| 70% | 70.1% | 100,854 | 100,957 |
| 60% | 60.2% | 86,447 | 86,804 |
| 50% | 50.3% | 72,039 | 72,540 |
| 40% | 40.1% | 57,631 | 57,812 |
| 30% | 29.7% | 43,223 | 42,722 |
| 20% | 20.3% | 28,816 | 29,181 |
| 10% | 10.1% | 14,408 | 14,506 |
| Active Idle | 0 | 0 | |
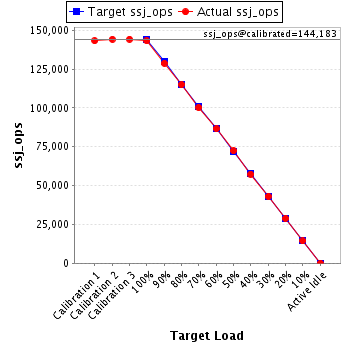
| Target Load | Actual Load | ssj_ops | |
|---|---|---|---|
| Target | Actual | ||
| Calibration 1 | 143,137 | ||
| Calibration 2 | 144,168 | ||
| Calibration 3 | 144,198 | ||
| ssj_ops@calibrated=144,183 | |||
| 100% | 99.2% | 144,183 | 143,065 |
| 90% | 89.3% | 129,765 | 128,694 |
| 80% | 79.7% | 115,347 | 114,866 |
| 70% | 69.5% | 100,928 | 100,175 |
| 60% | 60.0% | 86,510 | 86,551 |
| 50% | 50.2% | 72,092 | 72,313 |
| 40% | 39.8% | 57,673 | 57,362 |
| 30% | 29.9% | 43,255 | 43,073 |
| 20% | 20.1% | 28,837 | 28,918 |
| 10% | 10.0% | 14,418 | 14,358 |
| Active Idle | 0 | 0 | |
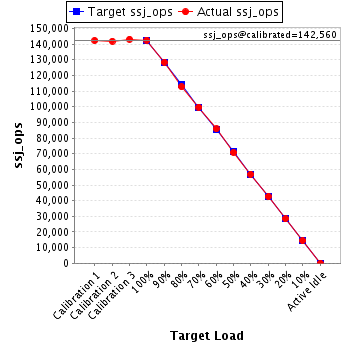
| Target Load | Actual Load | ssj_ops | |
|---|---|---|---|
| Target | Actual | ||
| Calibration 1 | 142,366 | ||
| Calibration 2 | 141,937 | ||
| Calibration 3 | 143,184 | ||
| ssj_ops@calibrated=142,560 | |||
| 100% | 100.0% | 142,560 | 142,586 |
| 90% | 90.1% | 128,304 | 128,489 |
| 80% | 79.1% | 114,048 | 112,735 |
| 70% | 70.0% | 99,792 | 99,801 |
| 60% | 60.2% | 85,536 | 85,863 |
| 50% | 49.7% | 71,280 | 70,824 |
| 40% | 39.9% | 57,024 | 56,903 |
| 30% | 29.9% | 42,768 | 42,648 |
| 20% | 19.9% | 28,512 | 28,400 |
| 10% | 10.2% | 14,256 | 14,491 |
| Active Idle | 0 | 0 | |
| Target Load | Actual Load | ssj_ops | |
|---|---|---|---|
| Target | Actual | ||
| Calibration 1 | 143,101 | ||
| Calibration 2 | 144,486 | ||
| Calibration 3 | 144,407 | ||
| ssj_ops@calibrated=144,447 | |||
| 100% | 98.9% | 144,447 | 142,872 |
| 90% | 90.6% | 130,002 | 130,886 |
| 80% | 80.1% | 115,557 | 115,765 |
| 70% | 69.5% | 101,113 | 100,342 |
| 60% | 59.9% | 86,668 | 86,456 |
| 50% | 50.3% | 72,223 | 72,700 |
| 40% | 40.0% | 57,779 | 57,766 |
| 30% | 30.0% | 43,334 | 43,279 |
| 20% | 20.0% | 28,889 | 28,853 |
| 10% | 10.0% | 14,445 | 14,435 |
| Active Idle | 0 | 0 | |

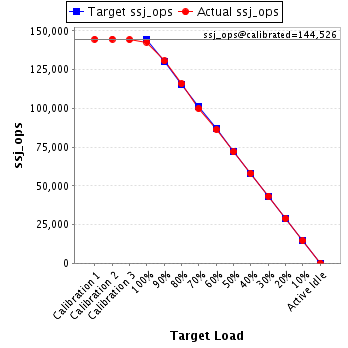
| Target Load | Actual Load | ssj_ops | |
|---|---|---|---|
| Target | Actual | ||
| Calibration 1 | 144,657 | ||
| Calibration 2 | 144,701 | ||
| Calibration 3 | 144,351 | ||
| ssj_ops@calibrated=144,526 | |||
| 100% | 98.8% | 144,526 | 142,831 |
| 90% | 90.4% | 130,073 | 130,613 |
| 80% | 80.2% | 115,621 | 115,887 |
| 70% | 69.1% | 101,168 | 99,899 |
| 60% | 59.7% | 86,716 | 86,350 |
| 50% | 49.8% | 72,263 | 71,929 |
| 40% | 40.1% | 57,810 | 57,991 |
| 30% | 30.0% | 43,358 | 43,365 |
| 20% | 19.9% | 28,905 | 28,799 |
| 10% | 10.1% | 14,453 | 14,621 |
| Active Idle | 0 | 0 | |
| Target Load | Actual Load | ssj_ops | |
|---|---|---|---|
| Target | Actual | ||
| Calibration 1 | 145,262 | ||
| Calibration 2 | 145,388 | ||
| Calibration 3 | 145,951 | ||
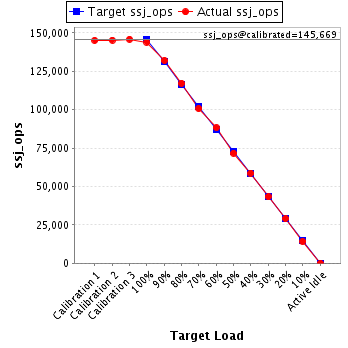
| ssj_ops@calibrated=145,669 | |||
| 100% | 98.9% | 145,669 | 144,020 |
| 90% | 90.7% | 131,102 | 132,179 |
| 80% | 80.6% | 116,536 | 117,355 |
| 70% | 69.2% | 101,969 | 100,829 |
| 60% | 60.6% | 87,402 | 88,304 |
| 50% | 49.3% | 72,835 | 71,749 |
| 40% | 40.3% | 58,268 | 58,758 |
| 30% | 29.7% | 43,701 | 43,329 |
| 20% | 19.9% | 29,134 | 29,055 |
| 10% | 9.8% | 14,567 | 14,291 |
| Active Idle | 0 | 0 | |