SPECpower_ssj2008
Host 'Node1' Performance Report
Copyright © 2007-2010 Standard Performance Evaluation Corporation
| Hewlett-Packard Company ProLiant DL170h G6 (2.93 GHz, Intel Xeon X5670 processor) | ssj_ops@100% = 865,106 ssj_ops@100% per JVM = 144,184 |
||||
| Test Sponsor: | Hewlett-Packard Company | SPEC License #: | 3 | Test Method: | Multi Node |
| Tested By: | Hewlett-Packard Company | Test Location: | Houston, TX, USA | Test Date: | Apr 5, 2010 |
| Hardware Availability: | Jun-2010 | Software Availability: | Sep-2009 | Publication: | Apr 21, 2010 |
| System Source: | Single Supplier | System Designation: | Server | Power Provisioning: | Line-powered |
| Target Load | Actual Load | ssj_ops | |
|---|---|---|---|
| Target | Actual | ||
| Calibration 1 | 864,088 | ||
| Calibration 2 | 863,411 | ||
| Calibration 3 | 866,400 | ||
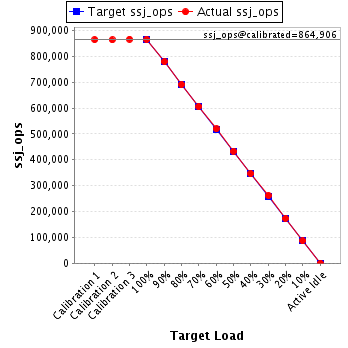
| ssj_ops@calibrated=864,906 | |||
| 100% | 100.0% | 864,906 | 865,106 |
| 90% | 90.1% | 778,415 | 778,940 |
| 80% | 79.9% | 691,925 | 690,666 |
| 70% | 70.0% | 605,434 | 605,628 |
| 60% | 60.1% | 518,944 | 519,576 |
| 50% | 50.1% | 432,453 | 433,731 |
| 40% | 40.0% | 345,962 | 346,065 |
| 30% | 30.3% | 259,472 | 261,773 |
| 20% | 20.1% | 172,981 | 173,592 |
| 10% | 10.0% | 86,491 | 86,439 |
| Active Idle | 0 | 0 | |
| Set Identifier: | sut |
| Set Description: | ProLiant DL4x170h G6 |
| # of Identical Nodes: | 4 |
| Comment: | System Under Test |
| Hardware | |
|---|---|
| Hardware Vendor: | Hewlett-Packard Company |
| Model: | ProLiant DL170h G6 (2.93 GHz, Intel Xeon X5670 processor) |
| Form Factor: | 1U |
| CPU Name: | Intel Xeon X5670 |
| CPU Characteristics: | Six-Core, 2.93 GHz, 12 MB L3 cache |
| CPU Frequency (MHz): | 2933 |
| CPU(s) Enabled: | 12 cores, 2 chips, 6 cores/chip |
| Hardware Threads: | 24 (2 / core) |
| CPU(s) Orderable: | 1,2 chips |
| Primary Cache: | 32 KB I + 32 KB D on chip per core |
| Secondary Cache: | 256 KB I+D on chip per core |
| Tertiary Cache: | 12 MB I+D on chip per chip |
| Other Cache: | None |
| Memory Amount (GB): | 16 |
| # and size of DIMM: | 4 x 4096 MB |
| Memory Details: | 4GB 2Rx8 PC3-10600E; slots 1 and 4 populated on each processor |
| Power Supply Quantity and Rating (W): | None |
| Power Supply Details: | Shared |
| Disk Drive: | 1 x 60GB SSD 2.5" SATA, HP part #:572071-B21 |
| Disk Controller: | Integrated SATA |
| # and type of Network Interface Cards (NICs) Installed: | 1 x Intel(R) 82576 Gigabit Dual Port Network Connection |
| NICs Enabled in Firmware / OS / Connected: | 2/2/1 |
| Network Speed (Mbit): | 1000 |
| Keyboard: | None |
| Mouse: | None |
| Monitor: | None |
| Optical Drives: | No |
| Other Hardware: | None |
| Software | |
|---|---|
| Power Management: | Power saver enabled in OS |
| Operating System (OS): | Windows Server 2008, Enterprise Edition |
| OS Version: | R2 |
| Filesystem: | NTFS |
| JVM Vendor: | IBM Corporation |
| JVM Version: | IBM J9 VM (build 2.4, J2RE 1.6.0 IBM J9 2.4 Windows Server 2008 amd64-64 jvmwa660sr5-20090519_35743 (JIT enabled, AOT enabled) |
| JVM Command-line Options: | -Xaggressive -Xcompressedrefs -Xgcpolicy:gencon -Xmn1500m -Xms1875m -Xmx1875m -XlockReservation -Xnoloa -XtlhPrefetch -Xlp |
| JVM Affinity: | Used "start /AFFINITY [0xF, 0xF0, 0xF00, 0xF000, 0xF0000, 0xF00000] |
| JVM Instances: | 6 |
| JVM Initial Heap (MB): | 1875 |
| JVM Maximum Heap (MB): | 1875 |
| JVM Address Bits: | 64 |
| Boot Firmware Version: | 034 04/02/2010 |
| Management Firmware Version: | 4.20 1/13/10 |
| Workload Version: | SSJ 1.2.6 |
| Director Location: | Controller |
| Other Software: | None |
| JVM Instance | ssj_ops@100% |
|---|---|
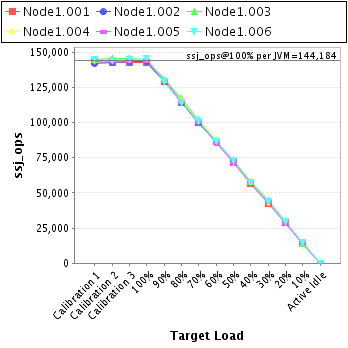
| Node1.001 | 142,607 |
| Node1.002 | 143,404 |
| Node1.003 | 144,862 |
| Node1.004 | 144,848 |
| Node1.005 | 143,931 |
| Node1.006 | 145,456 |
| ssj_ops@100% | 865,106 |
| ssj_ops@100% per JVM | 144,184 |
| Target Load | Actual Load | ssj_ops | |
|---|---|---|---|
| Target | Actual | ||
| Calibration 1 | 143,382 | ||
| Calibration 2 | 143,139 | ||
| Calibration 3 | 142,522 | ||
| ssj_ops@calibrated=142,830 | |||
| 100% | 99.8% | 142,830 | 142,607 |
| 90% | 90.3% | 128,547 | 129,029 |
| 80% | 80.0% | 114,264 | 114,314 |
| 70% | 70.1% | 99,981 | 100,154 |
| 60% | 60.5% | 85,698 | 86,483 |
| 50% | 50.3% | 71,415 | 71,910 |
| 40% | 39.8% | 57,132 | 56,858 |
| 30% | 29.8% | 42,849 | 42,516 |
| 20% | 20.2% | 28,566 | 28,787 |
| 10% | 10.0% | 14,283 | 14,295 |
| Active Idle | 0 | 0 | |

| Target Load | Actual Load | ssj_ops | |
|---|---|---|---|
| Target | Actual | ||
| Calibration 1 | 142,255 | ||
| Calibration 2 | 143,075 | ||
| Calibration 3 | 143,804 | ||
| ssj_ops@calibrated=143,440 | |||
| 100% | 100.0% | 143,440 | 143,404 |
| 90% | 90.3% | 129,096 | 129,474 |
| 80% | 79.6% | 114,752 | 114,165 |
| 70% | 70.0% | 100,408 | 100,406 |
| 60% | 59.9% | 86,064 | 85,977 |
| 50% | 50.6% | 71,720 | 72,641 |
| 40% | 40.1% | 57,376 | 57,499 |
| 30% | 30.7% | 43,032 | 44,010 |
| 20% | 20.1% | 28,688 | 28,767 |
| 10% | 10.1% | 14,344 | 14,422 |
| Active Idle | 0 | 0 | |

| Target Load | Actual Load | ssj_ops | |
|---|---|---|---|
| Target | Actual | ||
| Calibration 1 | 144,728 | ||
| Calibration 2 | 145,373 | ||
| Calibration 3 | 145,860 | ||
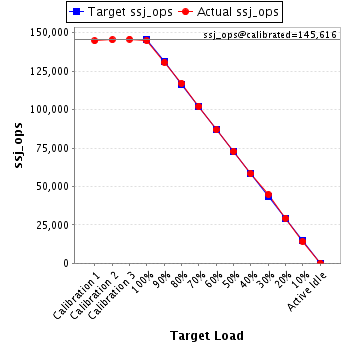
| ssj_ops@calibrated=145,616 | |||
| 100% | 99.5% | 145,616 | 144,862 |
| 90% | 89.8% | 131,055 | 130,782 |
| 80% | 80.5% | 116,493 | 117,177 |
| 70% | 70.1% | 101,931 | 102,117 |
| 60% | 59.7% | 87,370 | 86,862 |
| 50% | 50.0% | 72,808 | 72,832 |
| 40% | 40.0% | 58,247 | 58,198 |
| 30% | 30.7% | 43,685 | 44,763 |
| 20% | 20.2% | 29,123 | 29,375 |
| 10% | 9.7% | 14,562 | 14,195 |
| Active Idle | 0 | 0 | |
| Target Load | Actual Load | ssj_ops | |
|---|---|---|---|
| Target | Actual | ||
| Calibration 1 | 144,317 | ||
| Calibration 2 | 144,255 | ||
| Calibration 3 | 145,208 | ||
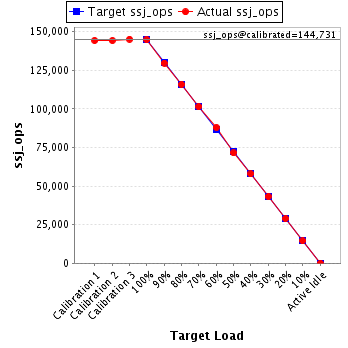
| ssj_ops@calibrated=144,731 | |||
| 100% | 100.1% | 144,731 | 144,848 |
| 90% | 89.7% | 130,258 | 129,759 |
| 80% | 80.1% | 115,785 | 115,888 |
| 70% | 70.1% | 101,312 | 101,450 |
| 60% | 60.8% | 86,839 | 87,968 |
| 50% | 49.4% | 72,366 | 71,449 |
| 40% | 40.0% | 57,893 | 57,857 |
| 30% | 29.9% | 43,419 | 43,268 |
| 20% | 20.0% | 28,946 | 28,953 |
| 10% | 10.0% | 14,473 | 14,475 |
| Active Idle | 0 | 0 | |
| Target Load | Actual Load | ssj_ops | |
|---|---|---|---|
| Target | Actual | ||
| Calibration 1 | 144,670 | ||
| Calibration 2 | 143,691 | ||
| Calibration 3 | 143,920 | ||
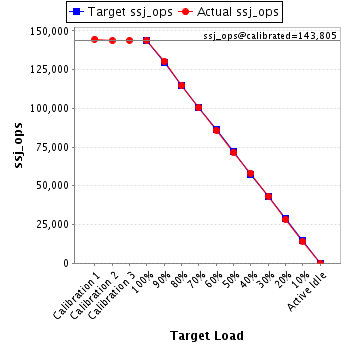
| ssj_ops@calibrated=143,805 | |||
| 100% | 100.1% | 143,805 | 143,931 |
| 90% | 90.7% | 129,425 | 130,457 |
| 80% | 80.0% | 115,044 | 115,034 |
| 70% | 70.0% | 100,664 | 100,613 |
| 60% | 59.7% | 86,283 | 85,874 |
| 50% | 49.8% | 71,903 | 71,657 |
| 40% | 40.5% | 57,522 | 58,178 |
| 30% | 30.1% | 43,142 | 43,257 |
| 20% | 19.7% | 28,761 | 28,363 |
| 10% | 9.9% | 14,381 | 14,195 |
| Active Idle | 0 | 0 | |
| Target Load | Actual Load | ssj_ops | |
|---|---|---|---|
| Target | Actual | ||
| Calibration 1 | 144,736 | ||
| Calibration 2 | 143,878 | ||
| Calibration 3 | 145,088 | ||
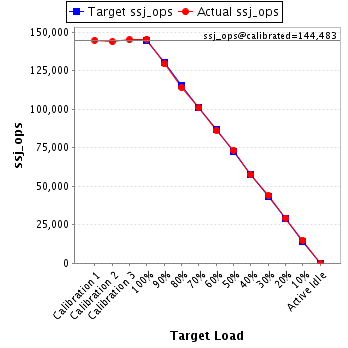
| ssj_ops@calibrated=144,483 | |||
| 100% | 100.7% | 144,483 | 145,456 |
| 90% | 89.6% | 130,035 | 129,438 |
| 80% | 79.0% | 115,586 | 114,088 |
| 70% | 69.8% | 101,138 | 100,888 |
| 60% | 59.8% | 86,690 | 86,413 |
| 50% | 50.7% | 72,241 | 73,242 |
| 40% | 39.8% | 57,793 | 57,476 |
| 30% | 30.4% | 43,345 | 43,960 |
| 20% | 20.3% | 28,897 | 29,348 |
| 10% | 10.3% | 14,448 | 14,858 |
| Active Idle | 0 | 0 | |