SPECpower_ssj2008
Host 'WIN-W9VDLALRRFR' Performance Report
Copyright © 2007-2010 Standard Performance Evaluation Corporation
| Fujitsu PRIMERGY TX150 S7 (Intel Xeon X3470) | ssj_ops@100% = 276,514 ssj_ops@100% per JVM = 138,257 |
||||
| Test Sponsor: | Fujitsu | SPEC License #: | 19 | Test Method: | Single Node |
| Tested By: | Fujitsu | Test Location: | Paderborn, NRW, Germany | Test Date: | Jan 11, 2010 |
| Hardware Availability: | Jan-2010 | Software Availability: | May-2009 | Publication: | Feb 2, 2010 |
| System Source: | Single Supplier | System Designation: | Server | Power Provisioning: | Line-powered |
| Target Load | Actual Load | ssj_ops | |
|---|---|---|---|
| Target | Actual | ||
| Calibration 1 | 274,164 | ||
| Calibration 2 | 276,161 | ||
| Calibration 3 | 277,184 | ||
| Calibration 4 | 278,437 | ||
| Calibration 5 | 276,533 | ||
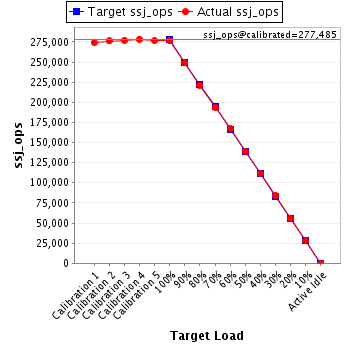
| ssj_ops@calibrated=277,485 | |||
| 100% | 99.7% | 277,485 | 276,514 |
| 90% | 89.8% | 249,736 | 249,279 |
| 80% | 79.8% | 221,988 | 221,473 |
| 70% | 69.8% | 194,239 | 193,621 |
| 60% | 60.2% | 166,491 | 167,143 |
| 50% | 50.2% | 138,742 | 139,181 |
| 40% | 40.2% | 110,994 | 111,429 |
| 30% | 30.3% | 83,245 | 84,147 |
| 20% | 19.8% | 55,497 | 55,068 |
| 10% | 10.0% | 27,748 | 27,788 |
| Active Idle | 0 | 0 | |
| Set Identifier: | SUT |
| Set Description: | System Under Test |
| # of Identical Nodes: | 1 |
| Comment: | None |
| Hardware | |
|---|---|
| Hardware Vendor: | Fujitsu |
| Model: | PRIMERGY TX150 S7 (Intel Xeon X3470) |
| Form Factor: | Tower |
| CPU Name: | Intel Xeon X3470 |
| CPU Characteristics: | Quad-Core, 2.93GHz, 8MB L3 Cache |
| CPU Frequency (MHz): | 2933 |
| CPU(s) Enabled: | 4 cores, 1 chip, 4 cores/chip |
| Hardware Threads: | 8 (2 / core) |
| CPU(s) Orderable: | 1 chip |
| Primary Cache: | 32 KB I + 32 KB D on chip per core |
| Secondary Cache: | 256 KB I+D on chip per core |
| Tertiary Cache: | 8 MB I+D on chip per chip |
| Other Cache: | None |
| Memory Amount (GB): | 4 |
| # and size of DIMM: | 2 x 2048 MB |
| Memory Details: | 2GB 2Rx8 PC3-10600E ECC CL9; slots 1A, 1B populated |
| Power Supply Quantity and Rating (W): | 1 x 350 |
| Power Supply Details: | Fujitsu Technology Solutions S26113-E549-V50-01 |
| Disk Drive: | 1 x 160GB HDD SATA (2.5", 5.4krpm) |
| Disk Controller: | Integrated SATA Controller |
| # and type of Network Interface Cards (NICs) Installed: | 1 x Intel 82574L Gigabit Network Connection (onboard) |
| NICs Enabled in Firmware / OS / Connected: | 1/1/1 |
| Network Speed (Mbit): | 1000 |
| Keyboard: | None |
| Mouse: | None |
| Monitor: | None |
| Optical Drives: | No |
| Other Hardware: | None |
| Software | |
|---|---|
| Power Management: | Enabled ("Fujitsu Enhanced Power Settings" power plan) |
| Operating System (OS): | Microsoft Windows Server 2008 Enterprise x64 Edition + SP2 |
| OS Version: | Version 6.0.6002 Service Pack 2 Build 6002 |
| Filesystem: | NTFS |
| JVM Vendor: | Oracle Corporation |
| JVM Version: | Oracle JRockit(R) 6 P28.0.0 (build P28.0.0-29-114096-1.6.0_11-20090427-1759-windows-x86_64) |
| JVM Command-line Options: | -Xms1625m -Xmx1625m -Xns1500m -XXaggressive -Xlargepages -Xgc:genpar -XXcallprofiling -XXgcthreads=4 -XXtlasize:min=4k,preferred=1024k |
| JVM Affinity: | start /affinity [0x0F,0xF0] |
| JVM Instances: | 2 |
| JVM Initial Heap (MB): | 1625 |
| JVM Maximum Heap (MB): | 1625 |
| JVM Address Bits: | 64 |
| Boot Firmware Version: | 1.05 |
| Management Firmware Version: | 3.88A |
| Workload Version: | SSJ 1.2.6 |
| Director Location: | Controller |
| Other Software: | None |
| JVM Instance | ssj_ops@100% |
|---|---|
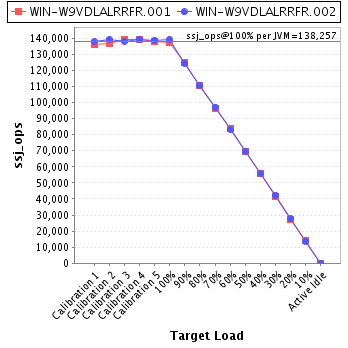
| WIN-W9VDLALRRFR.001 | 137,302 |
| WIN-W9VDLALRRFR.002 | 139,212 |
| ssj_ops@100% | 276,514 |
| ssj_ops@100% per JVM | 138,257 |
| Target Load | Actual Load | ssj_ops | |
|---|---|---|---|
| Target | Actual | ||
| Calibration 1 | 136,281 | ||
| Calibration 2 | 136,871 | ||
| Calibration 3 | 139,143 | ||
| Calibration 4 | 139,012 | ||
| Calibration 5 | 137,814 | ||
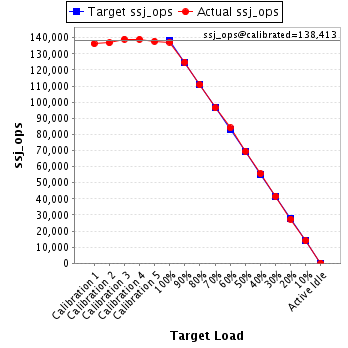
| ssj_ops@calibrated=138,413 | |||
| 100% | 99.2% | 138,413 | 137,302 |
| 90% | 90.3% | 124,572 | 124,936 |
| 80% | 80.1% | 110,731 | 110,813 |
| 70% | 69.8% | 96,889 | 96,579 |
| 60% | 60.7% | 83,048 | 84,013 |
| 50% | 50.2% | 69,207 | 69,541 |
| 40% | 40.2% | 55,365 | 55,602 |
| 30% | 30.1% | 41,524 | 41,725 |
| 20% | 19.8% | 27,683 | 27,455 |
| 10% | 10.1% | 13,841 | 14,019 |
| Active Idle | 0 | 0 | |
| Target Load | Actual Load | ssj_ops | |
|---|---|---|---|
| Target | Actual | ||
| Calibration 1 | 137,883 | ||
| Calibration 2 | 139,290 | ||
| Calibration 3 | 138,041 | ||
| Calibration 4 | 139,425 | ||
| Calibration 5 | 138,718 | ||
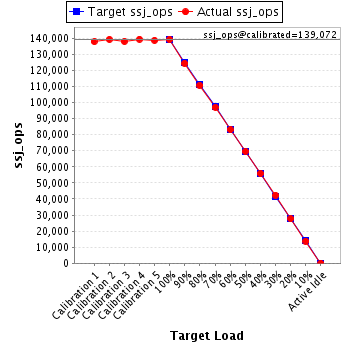
| ssj_ops@calibrated=139,072 | |||
| 100% | 100.1% | 139,072 | 139,212 |
| 90% | 89.4% | 125,165 | 124,343 |
| 80% | 79.6% | 111,257 | 110,660 |
| 70% | 69.8% | 97,350 | 97,042 |
| 60% | 59.8% | 83,443 | 83,130 |
| 50% | 50.1% | 69,536 | 69,640 |
| 40% | 40.1% | 55,629 | 55,828 |
| 30% | 30.5% | 41,722 | 42,422 |
| 20% | 19.9% | 27,814 | 27,613 |
| 10% | 9.9% | 13,907 | 13,770 |
| Active Idle | 0 | 0 | |