SPECpower_ssj2008
Host '0001' Performance Report
Copyright © 2007-2009 Standard Performance Evaluation Corporation
| Plat'Home TRQX-1/50SA | ssj_ops@100% = 276,488 ssj_ops@100% per JVM = 69,122 |
||||
| Test Sponsor: | Plat'Home | SPEC License #: | 3835 | Test Method: | Single Node |
| Tested By: | Plat'Home | Test Location: | Chiyoda-ku, Tokyo, Japan | Test Date: | 2009/05/19 |
| Hardware Availability: | Mar-2009 | Software Availability: | Mar-2009 | Publication: | Jun 10, 2009 |
| System Source: | Single Supplier | System Designation: | Server | Power Provisioning: | Line-powered |
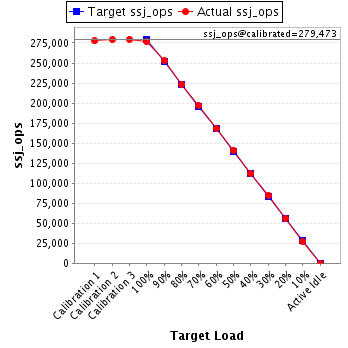
| Target Load | Actual Load | ssj_ops | |
|---|---|---|---|
| Target | Actual | ||
| Calibration 1 | 277,477 | ||
| Calibration 2 | 279,194 | ||
| Calibration 3 | 279,752 | ||
| ssj_ops@calibrated=279,473 | |||
| 100% | 98.9% | 279,473 | 276,488 |
| 90% | 90.4% | 251,526 | 252,606 |
| 80% | 79.9% | 223,579 | 223,257 |
| 70% | 70.4% | 195,631 | 196,803 |
| 60% | 60.1% | 167,684 | 168,098 |
| 50% | 50.5% | 139,737 | 141,019 |
| 40% | 40.0% | 111,789 | 111,865 |
| 30% | 30.2% | 83,842 | 84,408 |
| 20% | 20.0% | 55,895 | 55,861 |
| 10% | 9.9% | 27,947 | 27,759 |
| Active Idle | 0 | 0 | |
| Set Identifier: | sut |
| Set Description: | TRQX-1/50SA |
| # of Identical Nodes: | 1 |
| Comment: | None |
| Hardware | |
|---|---|
| Hardware Vendor: | Plat'Home |
| Model: | TRQX-1/50SA |
| Form Factor: | -- |
| CPU Name: | Xeon L5420 |
| CPU Characteristics: | Quad-Core, 2.50GHz, 12MB L2 Cache |
| CPU Frequency (MHz): | 2500 |
| CPU(s) Enabled: | 4 cores, 2 chips, 4 cores/chip |
| Hardware Threads: | 4 (1 / core) |
| CPU(s) Orderable: | 1,2 chips |
| Primary Cache: | 32 KB I+D on chip per core |
| Secondary Cache: | 12 MB I+D on chip per chip |
| Tertiary Cache: | None |
| Other Cache: | None |
| Memory Amount (GB): | 16 |
| # and size of DIMM: | 4 x 4 GB |
| Memory Details: | DDR2-667 CL5 FBDIMM; slots 1, 3, 5, and 7 populated |
| Power Supply Quantity and Rating (W): | 1 x 600 |
| Power Supply Details: | DELTA TDPS-600AB |
| Disk Drive: | 1 x 250GB 10K RPM SATA |
| Disk Controller: | Integrated SATA controller |
| # and type of Network Interface Cards (NICs) Installed: | 2 x Intel PRO/1000EB Network Adapter |
| NICs Enabled in Firmware / OS / Connected: | 2/2/1 |
| Network Speed (Mbit): | 1000 |
| Keyboard: | KVM |
| Mouse: | KVM |
| Monitor: | KVM |
| Optical Drives: | No |
| Other Hardware: | No |
| Software | |
|---|---|
| Power Management: | Balance(See SUT Notes) |
| Operating System (OS): | Windows Server 2003 Standard Edition |
| OS Version: | SP1(64-bit) |
| Filesystem: | NTFS |
| JVM Vendor: | Oracle |
| JVM Version: | BEA JRockit(R) (build R27.6.0-50_o-100423-1.6.0_05-20080626-2105-windows-x86_64,compiled mode) |
| JVM Command-line Options: | -Xms3700m -Xmx3700m -Xns3200m -XXaggressive -Xlargepages -Xgc:genpar -XXcallprofiling -XXgcthreads=2 -XXtlasize:min=4k,preferred=1024k -XXthroughputcompaction -XXlazyUnlocking |
| JVM Affinity: | start /affinity [0x03,0x30,0x0C,0xC0] |
| JVM Instances: | 4 |
| JVM Initial Heap (MB): | 3700 |
| JVM Maximum Heap (MB): | 3700 |
| JVM Address Bits: | 64 |
| Boot Firmware Version: | -- |
| Management Firmware Version: | -- |
| Workload Version: | SSJ 1.1.3 |
| Director Location: | Controller System |
| Other Software: | None |
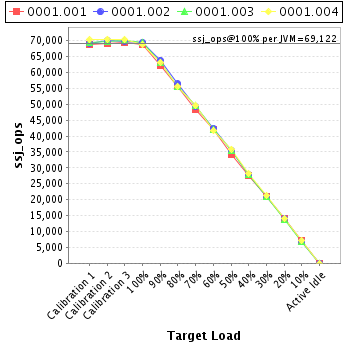
| JVM Instance | ssj_ops@100% |
|---|---|
| 0001.001 | 68,769 |
| 0001.002 | 69,446 |
| 0001.003 | 69,376 |
| 0001.004 | 68,896 |
| ssj_ops@100% | 276,488 |
| ssj_ops@100% per JVM | 69,122 |
| Target Load | Actual Load | ssj_ops | |
|---|---|---|---|
| Target | Actual | ||
| Calibration 1 | 68,758 | ||
| Calibration 2 | 68,971 | ||
| Calibration 3 | 69,485 | ||
| ssj_ops@calibrated=69,228 | |||
| 100% | 99.3% | 69,228 | 68,769 |
| 90% | 89.9% | 62,305 | 62,219 |
| 80% | 80.3% | 55,382 | 55,594 |
| 70% | 69.8% | 48,460 | 48,310 |
| 60% | 60.8% | 41,537 | 42,113 |
| 50% | 49.5% | 34,614 | 34,246 |
| 40% | 40.0% | 27,691 | 27,725 |
| 30% | 30.4% | 20,768 | 21,045 |
| 20% | 20.1% | 13,846 | 13,942 |
| 10% | 10.1% | 6,923 | 7,010 |
| Active Idle | 0 | 0 | |

| Target Load | Actual Load | ssj_ops | |
|---|---|---|---|
| Target | Actual | ||
| Calibration 1 | 69,151 | ||
| Calibration 2 | 70,013 | ||
| Calibration 3 | 69,889 | ||
| ssj_ops@calibrated=69,951 | |||
| 100% | 99.3% | 69,951 | 69,446 |
| 90% | 91.3% | 62,956 | 63,846 |
| 80% | 80.6% | 55,961 | 56,413 |
| 70% | 70.3% | 48,966 | 49,164 |
| 60% | 60.6% | 41,971 | 42,392 |
| 50% | 50.5% | 34,976 | 35,356 |
| 40% | 39.8% | 27,981 | 27,807 |
| 30% | 30.2% | 20,985 | 21,105 |
| 20% | 20.1% | 13,990 | 14,074 |
| 10% | 9.8% | 6,995 | 6,887 |
| Active Idle | 0 | 0 | |

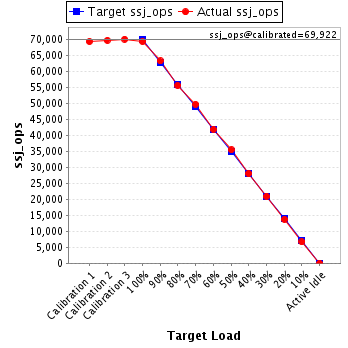
| Target Load | Actual Load | ssj_ops | |
|---|---|---|---|
| Target | Actual | ||
| Calibration 1 | 69,359 | ||
| Calibration 2 | 69,740 | ||
| Calibration 3 | 70,105 | ||
| ssj_ops@calibrated=69,922 | |||
| 100% | 99.2% | 69,922 | 69,376 |
| 90% | 90.5% | 62,930 | 63,290 |
| 80% | 79.5% | 55,938 | 55,598 |
| 70% | 71.2% | 48,946 | 49,757 |
| 60% | 60.0% | 41,953 | 41,926 |
| 50% | 50.8% | 34,961 | 35,498 |
| 40% | 40.1% | 27,969 | 28,060 |
| 30% | 30.0% | 20,977 | 20,995 |
| 20% | 19.6% | 13,984 | 13,718 |
| 10% | 9.6% | 6,992 | 6,708 |
| Active Idle | 0 | 0 | |
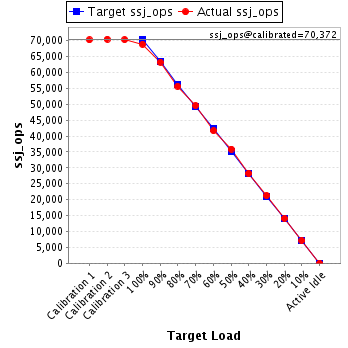
| Target Load | Actual Load | ssj_ops | |
|---|---|---|---|
| Target | Actual | ||
| Calibration 1 | 70,210 | ||
| Calibration 2 | 70,470 | ||
| Calibration 3 | 70,273 | ||
| ssj_ops@calibrated=70,372 | |||
| 100% | 97.9% | 70,372 | 68,896 |
| 90% | 89.9% | 63,335 | 63,251 |
| 80% | 79.1% | 56,297 | 55,652 |
| 70% | 70.4% | 49,260 | 49,572 |
| 60% | 59.2% | 42,223 | 41,667 |
| 50% | 51.0% | 35,186 | 35,919 |
| 40% | 40.2% | 28,149 | 28,273 |
| 30% | 30.2% | 21,112 | 21,264 |
| 20% | 20.1% | 14,074 | 14,126 |
| 10% | 10.2% | 7,037 | 7,154 |
| Active Idle | 0 | 0 | |