SPECpower_ssj2008
Host 'WIN-Z9KI31LNIIB' Performance Report
Copyright © 2007-2009 Standard Performance Evaluation Corporation
| ZT Systems 1224Ra Datacenter Server | ssj_ops@100% = 342,104 ssj_ops@100% per JVM = 171,052 |
||||
| Test Sponsor: | ZT Systems | SPEC License #: | 49 | Test Method: | Single Node |
| Tested By: | Advanced Micro Devices | Test Location: | Austin, TX, USA | Test Date: | Apr 24, 2009 |
| Hardware Availability: | May-2009 | Software Availability: | Dec-2008 | Publication: | May 20, 2009 |
| System Source: | Single Supplier | System Designation: | Server | Power Provisioning: | Line-powered |
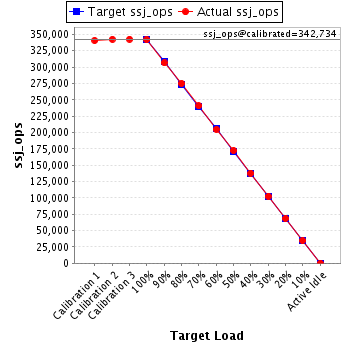
| Target Load | Actual Load | ssj_ops | |
|---|---|---|---|
| Target | Actual | ||
| Calibration 1 | 340,757 | ||
| Calibration 2 | 342,668 | ||
| Calibration 3 | 342,799 | ||
| ssj_ops@calibrated=342,734 | |||
| 100% | 99.8% | 342,734 | 342,104 |
| 90% | 89.5% | 308,460 | 306,578 |
| 80% | 80.3% | 274,187 | 275,265 |
| 70% | 70.3% | 239,913 | 240,820 |
| 60% | 59.8% | 205,640 | 204,887 |
| 50% | 50.3% | 171,367 | 172,480 |
| 40% | 40.3% | 137,093 | 137,962 |
| 30% | 29.9% | 102,820 | 102,555 |
| 20% | 20.0% | 68,547 | 68,552 |
| 10% | 10.1% | 34,273 | 34,678 |
| Active Idle | 0 | 0 | |
| Set Identifier: | sut |
| Set Description: | ZT Systems 1224Ra Datacenter Server 1U |
| # of Identical Nodes: | 1 |
| Comment: | None |
| Hardware | |
|---|---|
| Hardware Vendor: | ZT Systems |
| Model: | 1224Ra Datacenter Server |
| Form Factor: | 1U |
| CPU Name: | AMD Opteron 2377 EE |
| CPU Characteristics: | Quad-Core, 2.3GHz, 6MB L3 Cache |
| CPU Frequency (MHz): | 2300 |
| CPU(s) Enabled: | 8 cores, 2 chips, 4 cores/chip |
| Hardware Threads: | 8 (1 / core) |
| CPU(s) Orderable: | 2 chips |
| Primary Cache: | 64 KB I + 64 KB D on chip per core |
| Secondary Cache: | 512 KB I+D on chip per core |
| Tertiary Cache: | 6 MB I+D on chip per chip |
| Other Cache: | None |
| Memory Amount (GB): | 16 |
| # and size of DIMM: | 4 x 4096 MB |
| Memory Details: | 4GB 4Rx128 PC2-6400 ECC CL5; slots 3 and 4 populated per socket |
| Power Supply Quantity and Rating (W): | 1 x 400 |
| Power Supply Details: | Sparkle Power Int'l LTD SPI4001UG |
| Disk Drive: | 1 x 80GB Intel SSDSA2MH080G1GC SATAII |
| Disk Controller: | Integrated Nvidia nForce Serial ATA Controller |
| # and type of Network Interface Cards (NICs) Installed: | 2 x Nvidia nForce Networking Controller |
| NICs Enabled in Firmware / OS / Connected: | 2/2/1 |
| Network Speed (Mbit): | 1000 |
| Keyboard: | None |
| Mouse: | None |
| Monitor: | KVM |
| Optical Drives: | No |
| Other Hardware: | None |
| Software | |
|---|---|
| Power Management: | Balanced Power Profile enabled (see notes) |
| Operating System (OS): | Microsoft Windows Server 2008 Standard |
| OS Version: | Service Pack 1 (64-bit) |
| Filesystem: | NTFS |
| JVM Vendor: | IBM Corporation |
| JVM Version: | IBM J9 VM (build 2.4, J2RE 1.6.0 IBM J9 2.4 Windows Server 2008 amd64-64 jvmwa6460-20081105_25433 (JIT enabled, AOT enabled)) |
| JVM Command-line Options: | -Xcompressedrefs -Xgcpolicy:gencon -Xmn1400m -Xms1875m -Xmx1875m -XlockReservation -Xnoloa -Xlp -XtlhPrefetch |
| JVM Affinity: | start /affinity [0F,F0] |
| JVM Instances: | 2 |
| JVM Initial Heap (MB): | 1875 |
| JVM Maximum Heap (MB): | 1875 |
| JVM Address Bits: | 64 |
| Boot Firmware Version: | None |
| Management Firmware Version: | None |
| Workload Version: | SSJ 1.2.6 |
| Director Location: | Controller |
| Other Software: | None |
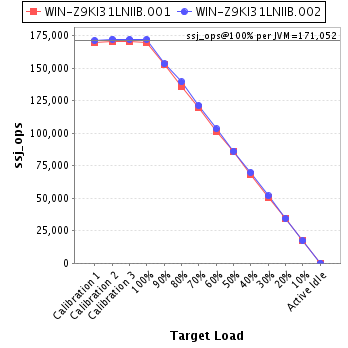
| JVM Instance | ssj_ops@100% |
|---|---|
| WIN-Z9KI31LNIIB.001 | 170,026 |
| WIN-Z9KI31LNIIB.002 | 172,078 |
| ssj_ops@100% | 342,104 |
| ssj_ops@100% per JVM | 171,052 |
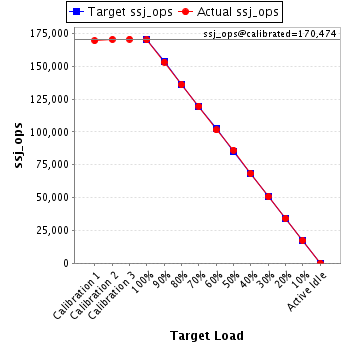
| Target Load | Actual Load | ssj_ops | |
|---|---|---|---|
| Target | Actual | ||
| Calibration 1 | 169,416 | ||
| Calibration 2 | 170,331 | ||
| Calibration 3 | 170,617 | ||
| ssj_ops@calibrated=170,474 | |||
| 100% | 99.7% | 170,474 | 170,026 |
| 90% | 89.9% | 153,426 | 153,216 |
| 80% | 79.7% | 136,379 | 135,867 |
| 70% | 70.2% | 119,332 | 119,606 |
| 60% | 59.5% | 102,284 | 101,497 |
| 50% | 50.5% | 85,237 | 86,146 |
| 40% | 40.0% | 68,189 | 68,266 |
| 30% | 29.8% | 51,142 | 50,752 |
| 20% | 20.1% | 34,095 | 34,191 |
| 10% | 10.2% | 17,047 | 17,362 |
| Active Idle | 0 | 0 | |
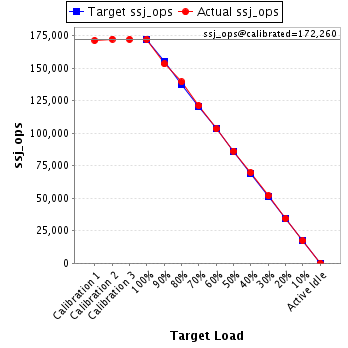
| Target Load | Actual Load | ssj_ops | |
|---|---|---|---|
| Target | Actual | ||
| Calibration 1 | 171,341 | ||
| Calibration 2 | 172,337 | ||
| Calibration 3 | 172,183 | ||
| ssj_ops@calibrated=172,260 | |||
| 100% | 99.9% | 172,260 | 172,078 |
| 90% | 89.0% | 155,034 | 153,362 |
| 80% | 80.9% | 137,808 | 139,398 |
| 70% | 70.4% | 120,582 | 121,214 |
| 60% | 60.0% | 103,356 | 103,389 |
| 50% | 50.1% | 86,130 | 86,334 |
| 40% | 40.5% | 68,904 | 69,696 |
| 30% | 30.1% | 51,678 | 51,803 |
| 20% | 19.9% | 34,452 | 34,361 |
| 10% | 10.1% | 17,226 | 17,316 |
| Active Idle | 0 | 0 | |