SPECpower_ssj2008
Host '0001' Performance Report
Copyright © 2007-2009 Standard Performance Evaluation Corporation
| Fujitsu PRIMERGY RX200 S4 (Intel Xeon L5430) | ssj_ops@100% = 327,292 ssj_ops@100% per JVM = 81,823 |
||||
| Test Sponsor: | Fujitsu | SPEC License #: | 19 | Test Method: | Single Node |
| Tested By: | Fujitsu Siemens Computers | Test Location: | Paderborn, NRW, Germany | Test Date: | 16.02.2009 |
| Hardware Availability: | Sep-2008 | Software Availability: | May-2009 | Publication: | Mar 11, 2009 |
| System Source: | Single Supplier | System Designation: | Server | Power Provisioning: | Line-powered |
| Target Load | Actual Load | ssj_ops | |
|---|---|---|---|
| Target | Actual | ||
| Calibration 1 | 330,320 | ||
| Calibration 2 | 328,654 | ||
| Calibration 3 | 327,544 | ||
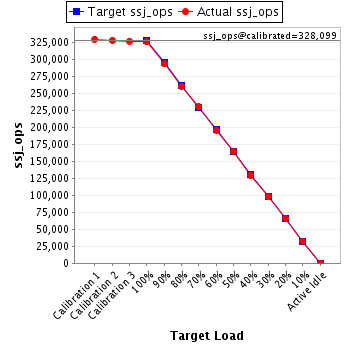
| ssj_ops@calibrated=328,099 | |||
| 100% | 99.8% | 328,099 | 327,292 |
| 90% | 89.6% | 295,289 | 293,838 |
| 80% | 79.6% | 262,479 | 261,060 |
| 70% | 70.4% | 229,670 | 230,880 |
| 60% | 59.8% | 196,860 | 196,194 |
| 50% | 50.0% | 164,050 | 164,127 |
| 40% | 39.6% | 131,240 | 130,081 |
| 30% | 29.8% | 98,430 | 97,922 |
| 20% | 20.0% | 65,620 | 65,607 |
| 10% | 10.0% | 32,810 | 32,730 |
| Active Idle | 0 | 0 | |
| Set Identifier: | sut |
| Set Description: | PRIMERGY RX200 S4 (Intel Xeon L5430) |
| # of Identical Nodes: | 1 |
| Comment: | None |
| Hardware | |
|---|---|
| Hardware Vendor: | Fujitsu |
| Model: | PRIMERGY RX200 S4 (Intel Xeon L5430) |
| Form Factor: | -- |
| CPU Name: | Intel Xeon L5430 |
| CPU Characteristics: | 2.66GHz, 2x6MB L2 cache, 1333MHz system bus |
| CPU Frequency (MHz): | 2667 |
| CPU(s) Enabled: | 8 cores, 2 chips, 4 cores/chip |
| Hardware Threads: | 8 (1 / core) |
| CPU(s) Orderable: | 1,2 chips |
| Primary Cache: | 32 KB I + 32 KB D on chip per core |
| Secondary Cache: | 12 MB I+D on chip per chip, 6 MB shared / 2 cores |
| Tertiary Cache: | None |
| Other Cache: | None |
| Memory Amount (GB): | 8 |
| # and size of DIMM: | 4 x 2048 MB |
| Memory Details: | 2GB 2Rx8 PC2-5300F ECC CL5; slots 1A, 1B, 1C, 1D populated |
| Power Supply Quantity and Rating (W): | 1 x 650 |
| Power Supply Details: | Delta Electronics, Inc DPS-650JB C |
| Disk Drive: | 1 x Seagate (3.5", SATA, 250GB, 7.2krpm) |
| Disk Controller: | Integrated SATA Controller |
| # and type of Network Interface Cards (NICs) Installed: | 2 x Broadcom BCM5708C NetXtreme II GigE (onboard) |
| NICs Enabled in Firmware / OS / Connected: | 1/1/1 |
| Network Speed (Mbit): | 1000 |
| Keyboard: | KVM |
| Mouse: | KVM |
| Monitor: | KVM |
| Optical Drives: | No |
| Other Hardware: | None |
| Software | |
|---|---|
| Power Management: | Enabled ("Balanced" power scheme) |
| Operating System (OS): | Microsoft Windows Server 2008 Enterprise x64 Edition + SP2 |
| OS Version: | Version 6.0.6002 Service Pack 2, v.641 Build 6002 |
| Filesystem: | NTFS |
| JVM Vendor: | Oracle Corporation |
| JVM Version: | Oracle JRockit(R) 6 P28.0.0 (build P28.0.0-8-109238-1.6.0_05-20090130-1408-windows-x86_64) |
| JVM Command-line Options: | -Xms1700m -Xmx1700m -Xns1500m -XXaggressive -Xlargepages -Xgc:genpar -XXcallprofiling -XXgcthreads=2 -XXtlasize:min=4k,preferred=1024k -XXthroughputcompaction -XX:+UseStringCache |
| JVM Affinity: | start /affinity [0x03,0x30,0x0C,0xC0] |
| JVM Instances: | 8 |
| JVM Initial Heap (MB): | 1700 |
| JVM Maximum Heap (MB): | 1700 |
| JVM Address Bits: | 64 |
| Boot Firmware Version: | -- |
| Management Firmware Version: | -- |
| Workload Version: | SSJ 1.1.3 |
| Director Location: | Controller |
| Other Software: | None |
| JVM Instance | ssj_ops@100% |
|---|---|
| 0001.001 | 81,825 |
| 0001.002 | 81,778 |
| 0001.003 | 82,229 |
| 0001.004 | 81,459 |
| ssj_ops@100% | 327,292 |
| ssj_ops@100% per JVM | 81,823 |

| Target Load | Actual Load | ssj_ops | |
|---|---|---|---|
| Target | Actual | ||
| Calibration 1 | 82,984 | ||
| Calibration 2 | 82,073 | ||
| Calibration 3 | 81,771 | ||
| ssj_ops@calibrated=81,922 | |||
| 100% | 99.9% | 81,922 | 81,825 |
| 90% | 90.5% | 73,730 | 74,156 |
| 80% | 80.0% | 65,538 | 65,527 |
| 70% | 71.1% | 57,345 | 58,245 |
| 60% | 60.0% | 49,153 | 49,144 |
| 50% | 50.2% | 40,961 | 41,148 |
| 40% | 39.9% | 32,769 | 32,678 |
| 30% | 29.7% | 24,577 | 24,349 |
| 20% | 19.9% | 16,384 | 16,341 |
| 10% | 9.7% | 8,192 | 7,983 |
| Active Idle | 0 | 0 | |

| Target Load | Actual Load | ssj_ops | |
|---|---|---|---|
| Target | Actual | ||
| Calibration 1 | 82,499 | ||
| Calibration 2 | 81,873 | ||
| Calibration 3 | 81,621 | ||
| ssj_ops@calibrated=81,747 | |||
| 100% | 100.0% | 81,747 | 81,778 |
| 90% | 90.1% | 73,573 | 73,640 |
| 80% | 79.5% | 65,398 | 64,966 |
| 70% | 70.2% | 57,223 | 57,390 |
| 60% | 58.8% | 49,048 | 48,104 |
| 50% | 49.5% | 40,874 | 40,454 |
| 40% | 39.5% | 32,699 | 32,307 |
| 30% | 29.9% | 24,524 | 24,479 |
| 20% | 20.0% | 16,349 | 16,366 |
| 10% | 10.1% | 8,175 | 8,233 |
| Active Idle | 0 | 0 | |

| Target Load | Actual Load | ssj_ops | |
|---|---|---|---|
| Target | Actual | ||
| Calibration 1 | 82,504 | ||
| Calibration 2 | 82,410 | ||
| Calibration 3 | 82,279 | ||
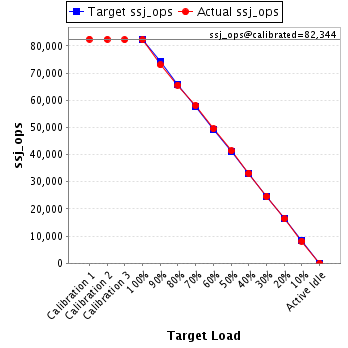
| ssj_ops@calibrated=82,344 | |||
| 100% | 99.9% | 82,344 | 82,229 |
| 90% | 88.7% | 74,110 | 73,020 |
| 80% | 79.7% | 65,876 | 65,630 |
| 70% | 70.5% | 57,641 | 58,087 |
| 60% | 60.1% | 49,407 | 49,484 |
| 50% | 50.2% | 41,172 | 41,363 |
| 40% | 40.2% | 32,938 | 33,124 |
| 30% | 29.8% | 24,703 | 24,574 |
| 20% | 19.8% | 16,469 | 16,337 |
| 10% | 9.9% | 8,234 | 8,129 |
| Active Idle | 0 | 0 | |
| Target Load | Actual Load | ssj_ops | |
|---|---|---|---|
| Target | Actual | ||
| Calibration 1 | 82,332 | ||
| Calibration 2 | 82,298 | ||
| Calibration 3 | 81,873 | ||
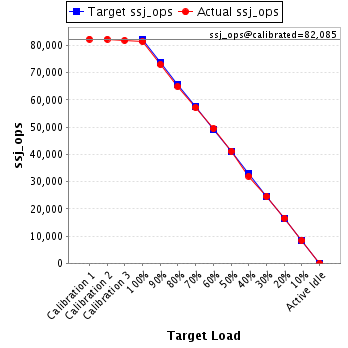
| ssj_ops@calibrated=82,085 | |||
| 100% | 99.2% | 82,085 | 81,459 |
| 90% | 89.0% | 73,877 | 73,022 |
| 80% | 79.1% | 65,668 | 64,937 |
| 70% | 69.6% | 57,460 | 57,159 |
| 60% | 60.3% | 49,251 | 49,462 |
| 50% | 50.1% | 41,043 | 41,162 |
| 40% | 38.9% | 32,834 | 31,972 |
| 30% | 29.9% | 24,626 | 24,520 |
| 20% | 20.2% | 16,417 | 16,562 |
| 10% | 10.2% | 8,209 | 8,385 |
| Active Idle | 0 | 0 | |