SPECpower_ssj2008
Host '0001' Performance Report
Copyright © 2007-2008 Standard Performance Evaluation Corporation
| Acer Incorporated Altos R520 | ssj_ops@100% = 274,923 ssj_ops@100% per JVM = 68,731 |
||||
| Test Sponsor: | Acer Incorporated | SPEC License #: | 97 | Test Method: | Single Node |
| Tested By: | Acer Incorporated | Test Location: | Taipei, Taiwan, R.O.C. | Test Date: | Nov 24, 2008 |
| Hardware Availability: | Sep-2008 | Software Availability: | Sep-2008 | Publication: | Dec 17, 2008 |
| System Source: | Single Supplier | System Designation: | Server | Power Provisioning: | Line-powered |
| Target Load | Actual Load | ssj_ops | |
|---|---|---|---|
| Target | Actual | ||
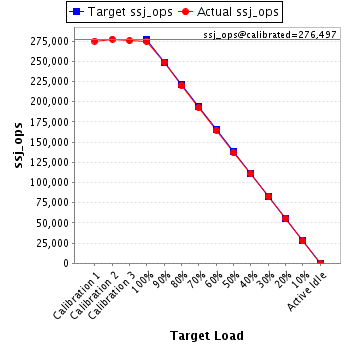
| Calibration 1 | 275,238 | ||
| Calibration 2 | 277,508 | ||
| Calibration 3 | 275,485 | ||
| ssj_ops@calibrated=276,497 | |||
| 100% | 99.4% | 276,497 | 274,923 |
| 90% | 90.1% | 248,847 | 249,042 |
| 80% | 79.6% | 221,197 | 220,098 |
| 70% | 69.7% | 193,548 | 192,784 |
| 60% | 59.7% | 165,898 | 165,019 |
| 50% | 49.5% | 138,248 | 136,746 |
| 40% | 40.0% | 110,599 | 110,590 |
| 30% | 30.0% | 82,949 | 82,862 |
| 20% | 20.1% | 55,299 | 55,474 |
| 10% | 10.0% | 27,650 | 27,600 |
| Active Idle | 0 | 0 | |

| Set Identifier: | sut |
| Set Description: | Altos R520 |
| # of Identical Nodes: | 1 |
| Comment: | None |
| Hardware | |
|---|---|
| Hardware Vendor: | Acer Incorporated |
| Model: | Altos R520 |
| Form Factor: | -- |
| CPU Name: | Intel Xeon L5430 |
| CPU Characteristics: | 2.66 GHz, 2x6 MB L2 shared, 1333 MHz system bus |
| CPU Frequency (MHz): | 2667 |
| CPU(s) Enabled: | 8 cores, 2 chips, 4 cores/chip |
| Hardware Threads: | 8 (1 / core) |
| CPU(s) Orderable: | 1,2 chips |
| Primary Cache: | 32 KB I + 32 KB D on chip per core |
| Secondary Cache: | 12 MB I+D on chip per chip, 6 MB shared / 2 cores |
| Tertiary Cache: | None |
| Other Cache: | None |
| Memory Amount (GB): | 8 |
| # and size of DIMM: | 2 x 4 GB |
| Memory Details: | DDR2-667 CL5 FBDIMM; slots 1, 5 populated |
| Power Supply Quantity and Rating (W): | 1 x 650 |
| Power Supply Details: | COLDWATT CWA2-0650-10-IT01 Redundant Power Supply |
| Disk Drive: | 1 x Hitachi HTS541616J9SA00 160GB 5400 RPM SATA |
| Disk Controller: | onboard SATA controller |
| # and type of Network Interface Cards (NICs) Installed: | 2 x onboard Intel PRO/1000 gigabit network interface controller with Intel I/O Acceleration Technology |
| NICs Enabled in Firmware / OS / Connected: | 2/2/1 |
| Network Speed (Mbit): | 1000 |
| Keyboard: | KVM |
| Mouse: | KVM |
| Monitor: | KVM |
| Optical Drives: | Yes |
| Other Hardware: | None |
| Software | |
|---|---|
| Power Management: | Enabled (Server Balanced Processor Power and Performance) |
| Operating System (OS): | Microsoft Windows Server 2003 x64 Enterprise Edition |
| OS Version: | R2 SP2 |
| Filesystem: | NTFS |
| JVM Vendor: | Oracle Corporation |
| JVM Version: | Oracle JRockit(R) (build R27.5.0-110_o-99226-1.6.0_03-20080528-1505-windows-x86_64, compiled mode) |
| JVM Command-line Options: | -Xms1600m -Xmx1600m -Xns1300m -XXaggressive -XXlargePages -XXthroughputCompaction -XXcallprofiling -XXlazyUnlocking -Xgc:genpar -XXgcthreads:2 -XXtlasize:min=12k,preferred=256k |
| JVM Affinity: | start /affinity [03, 0C, 30, C0] |
| JVM Instances: | 8 |
| JVM Initial Heap (MB): | 1600 |
| JVM Maximum Heap (MB): | 1600 |
| JVM Address Bits: | 64 |
| Boot Firmware Version: | -- |
| Management Firmware Version: | -- |
| Workload Version: | SSJ 1.1.3 |
| Director Location: | Controller |
| Other Software: | None |
| JVM Instance | ssj_ops@100% |
|---|---|
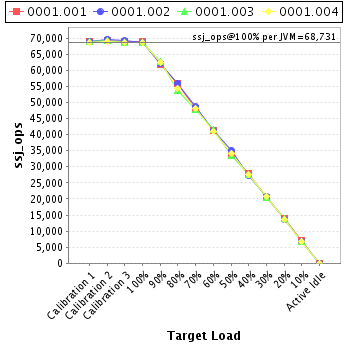
| 0001.001 | 69,027 |
| 0001.002 | 68,778 |
| 0001.003 | 68,524 |
| 0001.004 | 68,594 |
| ssj_ops@100% | 274,923 |
| ssj_ops@100% per JVM | 68,731 |

| Target Load | Actual Load | ssj_ops | |
|---|---|---|---|
| Target | Actual | ||
| Calibration 1 | 68,832 | ||
| Calibration 2 | 69,380 | ||
| Calibration 3 | 68,884 | ||
| ssj_ops@calibrated=69,132 | |||
| 100% | 99.8% | 69,132 | 69,027 |
| 90% | 89.3% | 62,219 | 61,761 |
| 80% | 80.9% | 55,306 | 55,952 |
| 70% | 69.7% | 48,393 | 48,160 |
| 60% | 59.6% | 41,479 | 41,179 |
| 50% | 49.1% | 34,566 | 33,966 |
| 40% | 40.6% | 27,653 | 28,072 |
| 30% | 29.7% | 20,740 | 20,515 |
| 20% | 20.3% | 13,826 | 14,068 |
| 10% | 10.3% | 6,913 | 7,096 |
| Active Idle | 0 | 0 | |

| Target Load | Actual Load | ssj_ops | |
|---|---|---|---|
| Target | Actual | ||
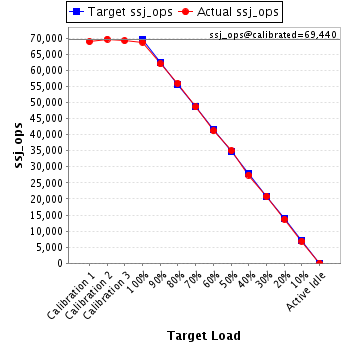
| Calibration 1 | 68,927 | ||
| Calibration 2 | 69,694 | ||
| Calibration 3 | 69,186 | ||
| ssj_ops@calibrated=69,440 | |||
| 100% | 99.0% | 69,440 | 68,778 |
| 90% | 89.3% | 62,496 | 62,010 |
| 80% | 80.6% | 55,552 | 55,942 |
| 70% | 70.0% | 48,608 | 48,608 |
| 60% | 59.3% | 41,664 | 41,176 |
| 50% | 50.5% | 34,720 | 35,035 |
| 40% | 39.5% | 27,776 | 27,440 |
| 30% | 30.0% | 20,832 | 20,836 |
| 20% | 19.7% | 13,888 | 13,694 |
| 10% | 9.9% | 6,944 | 6,871 |
| Active Idle | 0 | 0 | |

| Target Load | Actual Load | ssj_ops | |
|---|---|---|---|
| Target | Actual | ||
| Calibration 1 | 68,902 | ||
| Calibration 2 | 69,383 | ||
| Calibration 3 | 68,700 | ||
| ssj_ops@calibrated=69,041 | |||
| 100% | 99.3% | 69,041 | 68,524 |
| 90% | 91.0% | 62,137 | 62,842 |
| 80% | 77.9% | 55,233 | 53,778 |
| 70% | 69.4% | 48,329 | 47,923 |
| 60% | 60.3% | 41,425 | 41,602 |
| 50% | 48.6% | 34,521 | 33,532 |
| 40% | 40.0% | 27,617 | 27,587 |
| 30% | 29.8% | 20,712 | 20,593 |
| 20% | 20.2% | 13,808 | 13,954 |
| 10% | 10.0% | 6,904 | 6,900 |
| Active Idle | 0 | 0 | |

| Target Load | Actual Load | ssj_ops | |
|---|---|---|---|
| Target | Actual | ||
| Calibration 1 | 68,576 | ||
| Calibration 2 | 69,051 | ||
| Calibration 3 | 68,714 | ||
| ssj_ops@calibrated=68,883 | |||
| 100% | 99.6% | 68,883 | 68,594 |
| 90% | 90.6% | 61,995 | 62,429 |
| 80% | 79.0% | 55,106 | 54,426 |
| 70% | 69.8% | 48,218 | 48,093 |
| 60% | 59.6% | 41,330 | 41,061 |
| 50% | 49.7% | 34,441 | 34,213 |
| 40% | 39.9% | 27,553 | 27,491 |
| 30% | 30.4% | 20,665 | 20,918 |
| 20% | 20.0% | 13,777 | 13,758 |
| 10% | 9.8% | 6,888 | 6,733 |
| Active Idle | 0 | 0 | |
