SPECpower_ssj2008
Host '0001' Performance Report
Copyright © 2007-2008 Standard Performance Evaluation Corporation
| Hewlett-Packard Company ProLiant DL585 G5 (2.70GHz, AMD Opteron 8384) | ssj_ops@100% = 622,890 ssj_ops@100% per JVM = 155,722 |
||||
| Test Sponsor: | Hewlett-Packard Company | SPEC License #: | 3 | Test Method: | Single Node |
| Tested By: | Hewlett-Packard Company | Test Location: | Houston, TX | Test Date: | Oct 21, 2008 |
| Hardware Availability: | Nov-2008 | Software Availability: | Apr-2008 | Publication: | Dec 4, 2008 |
| System Source: | Single Supplier | System Designation: | Server | Power Provisioning: | Line-powered |
| Target Load | Actual Load | ssj_ops | |
|---|---|---|---|
| Target | Actual | ||
| Calibration 1 | 637,763 | ||
| Calibration 2 | 634,841 | ||
| Calibration 3 | 634,220 | ||
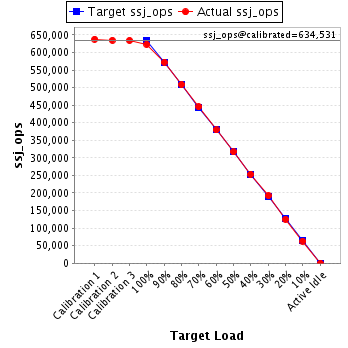
| ssj_ops@calibrated=634,531 | |||
| 100% | 98.2% | 634,531 | 622,890 |
| 90% | 90.2% | 571,078 | 572,318 |
| 80% | 80.1% | 507,625 | 508,260 |
| 70% | 70.2% | 444,171 | 445,466 |
| 60% | 59.8% | 380,718 | 379,359 |
| 50% | 49.9% | 317,265 | 316,764 |
| 40% | 39.9% | 253,812 | 253,455 |
| 30% | 30.3% | 190,359 | 192,198 |
| 20% | 19.7% | 126,906 | 125,305 |
| 10% | 10.0% | 63,453 | 63,329 |
| Active Idle | 0 | 0 | |
| Set Identifier: | sut |
| Set Description: | ProLiant DL585 G5 (2.70GHz, AMD Opteron 8384) |
| # of Identical Nodes: | 1 |
| Comment: | None |
| Software | |
|---|---|
| Power Management: | HP Dynamic Power Regulator enabled |
| Operating System (OS): | Microsoft Windows Server 2003 x64 Enterprise Edition |
| OS Version: | R2 |
| Filesystem: | NTFS |
| JVM Vendor: | Oracle Corporation |
| JVM Version: | BEA JRockit(R) (build P27.5.0-5-97156-1.6.0_03-20080403-1524-windows-x86_64, compiled mode) |
| JVM Command-line Options: | -Xms3600m -Xmx3600m -Xns3100m -XXaggressive -XlargePages -XXthroughputCompaction -XXcallprofiling -XXlazyUnlocking -Xgc:genpar -XXgcthreads:4 -XXtlasize:min=12k,preferred=1024k |
| JVM Affinity: | Used "start /AFFINITY" "0xF","0xF0","0xF00","0xF000" CPU masks. |
| JVM Instances: | 8 |
| JVM Initial Heap (MB): | 3600 |
| JVM Maximum Heap (MB): | 3600 |
| JVM Address Bits: | 64 |
| Boot Firmware Version: | -- |
| Management Firmware Version: | -- |
| Workload Version: | SSJ 1.1.3 |
| Director Location: | Controller |
| Other Software: | None |
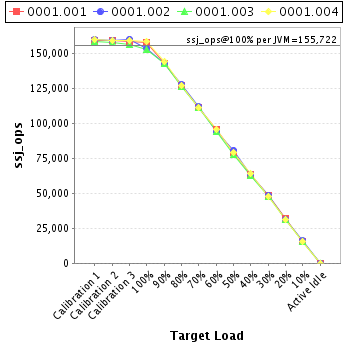
| JVM Instance | ssj_ops@100% |
|---|---|
| 0001.001 | 158,017 |
| 0001.002 | 153,505 |
| 0001.003 | 152,772 |
| 0001.004 | 158,596 |
| ssj_ops@100% | 622,890 |
| ssj_ops@100% per JVM | 155,722 |
| Target Load | Actual Load | ssj_ops | |
|---|---|---|---|
| Target | Actual | ||
| Calibration 1 | 159,508 | ||
| Calibration 2 | 159,274 | ||
| Calibration 3 | 158,264 | ||
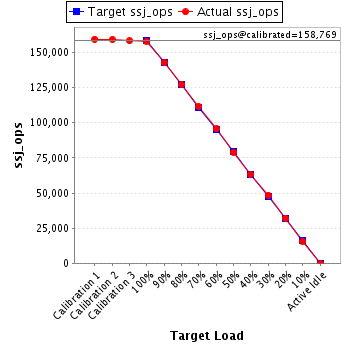
| ssj_ops@calibrated=158,769 | |||
| 100% | 99.5% | 158,769 | 158,017 |
| 90% | 89.9% | 142,892 | 142,758 |
| 80% | 80.2% | 127,015 | 127,281 |
| 70% | 70.2% | 111,138 | 111,530 |
| 60% | 60.3% | 95,262 | 95,693 |
| 50% | 49.9% | 79,385 | 79,170 |
| 40% | 39.9% | 63,508 | 63,380 |
| 30% | 30.4% | 47,631 | 48,305 |
| 20% | 20.2% | 31,754 | 32,019 |
| 10% | 9.9% | 15,877 | 15,735 |
| Active Idle | 0 | 0 | |
| Target Load | Actual Load | ssj_ops | |
|---|---|---|---|
| Target | Actual | ||
| Calibration 1 | 159,958 | ||
| Calibration 2 | 158,988 | ||
| Calibration 3 | 160,151 | ||
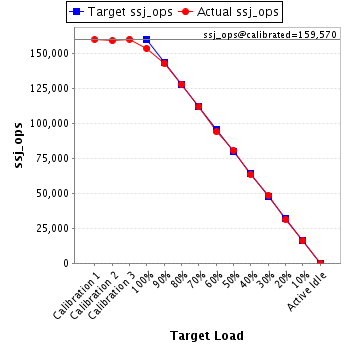
| ssj_ops@calibrated=159,570 | |||
| 100% | 96.2% | 159,570 | 153,505 |
| 90% | 89.6% | 143,613 | 142,943 |
| 80% | 80.1% | 127,656 | 127,808 |
| 70% | 70.0% | 111,699 | 111,755 |
| 60% | 58.9% | 95,742 | 94,020 |
| 50% | 50.6% | 79,785 | 80,674 |
| 40% | 39.9% | 63,828 | 63,656 |
| 30% | 30.4% | 47,871 | 48,516 |
| 20% | 19.6% | 31,914 | 31,280 |
| 10% | 10.0% | 15,957 | 15,946 |
| Active Idle | 0 | 0 | |
| Target Load | Actual Load | ssj_ops | |
|---|---|---|---|
| Target | Actual | ||
| Calibration 1 | 158,596 | ||
| Calibration 2 | 157,446 | ||
| Calibration 3 | 156,518 | ||
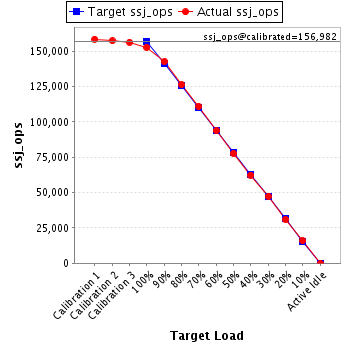
| ssj_ops@calibrated=156,982 | |||
| 100% | 97.3% | 156,982 | 152,772 |
| 90% | 90.9% | 141,284 | 142,744 |
| 80% | 80.5% | 125,586 | 126,318 |
| 70% | 70.8% | 109,887 | 111,112 |
| 60% | 59.8% | 94,189 | 93,840 |
| 50% | 49.4% | 78,491 | 77,578 |
| 40% | 39.8% | 62,793 | 62,444 |
| 30% | 30.2% | 47,095 | 47,415 |
| 20% | 19.8% | 31,396 | 31,024 |
| 10% | 10.1% | 15,698 | 15,883 |
| Active Idle | 0 | 0 | |
| Target Load | Actual Load | ssj_ops | |
|---|---|---|---|
| Target | Actual | ||
| Calibration 1 | 159,700 | ||
| Calibration 2 | 159,133 | ||
| Calibration 3 | 159,287 | ||
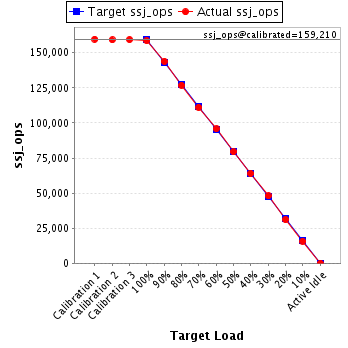
| ssj_ops@calibrated=159,210 | |||
| 100% | 99.6% | 159,210 | 158,596 |
| 90% | 90.4% | 143,289 | 143,873 |
| 80% | 79.7% | 127,368 | 126,853 |
| 70% | 69.8% | 111,447 | 111,070 |
| 60% | 60.2% | 95,526 | 95,806 |
| 50% | 49.8% | 79,605 | 79,343 |
| 40% | 40.2% | 63,684 | 63,975 |
| 30% | 30.1% | 47,763 | 47,961 |
| 20% | 19.5% | 31,842 | 30,982 |
| 10% | 9.9% | 15,921 | 15,766 |
| Active Idle | 0 | 0 | |