SPECpower_ssj2008
Host '0001' Performance Report
Copyright © 2007-2008 Standard Performance Evaluation Corporation
| Fujitsu Siemens Computers PRIMERGY RX100 S5 (Intel Xeon X3360) | ssj_ops@100% = 185,487 ssj_ops@100% per JVM = 92,744 |
||||
| Test Sponsor: | Fujitsu Siemens Computers | SPEC License #: | 22 | Test Method: | Single Node |
| Tested By: | Fujitsu Siemens Computers | Test Location: | Paderborn, NRW, Germany | Test Date: | Sep 10, 2008 |
| Hardware Availability: | Sep-2008 | Software Availability: | Jul-2008 | Publication: | Sep 24, 2008 |
| System Source: | Single Supplier | System Designation: | Server | Power Provisioning: | Line-powered |
| Target Load | Actual Load | ssj_ops | |
|---|---|---|---|
| Target | Actual | ||
| Calibration 1 | 181,961 | ||
| Calibration 2 | 184,938 | ||
| Calibration 3 | 185,911 | ||
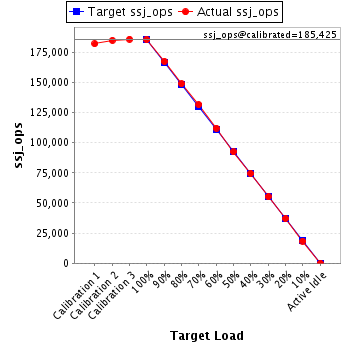
| ssj_ops@calibrated=185,425 | |||
| 100% | 100.0% | 185,425 | 185,487 |
| 90% | 90.3% | 166,882 | 167,508 |
| 80% | 80.3% | 148,340 | 148,858 |
| 70% | 71.0% | 129,797 | 131,637 |
| 60% | 60.5% | 111,255 | 112,098 |
| 50% | 49.8% | 92,712 | 92,304 |
| 40% | 40.2% | 74,170 | 74,481 |
| 30% | 29.8% | 55,627 | 55,183 |
| 20% | 20.0% | 37,085 | 37,095 |
| 10% | 9.9% | 18,542 | 18,436 |
| Active Idle | 0 | 0 | |
| Set Identifier: | sut |
| Set Description: | PRIMERGY RX100 S5 (Intel Xeon X3360) |
| # of Identical Nodes: | 1 |
| Comment: | None |
| Hardware | |
|---|---|
| Hardware Vendor: | Fujitsu Siemens Computers |
| Model: | PRIMERGY RX100 S5 (Intel Xeon X3360) |
| Form Factor: | -- |
| CPU Name: | Intel Xeon X3360 |
| CPU Characteristics: | 2.83 GHz, 2x6MB L2 cache, 1333MHz system bus |
| CPU Frequency (MHz): | 2833 |
| CPU(s) Enabled: | 4 cores, 1 chip, 4 cores/chip |
| Hardware Threads: | 4 (1 / core) |
| CPU(s) Orderable: | 1 chip |
| Primary Cache: | 32 KB I + 32 KB D on chip per core |
| Secondary Cache: | 12 MB I+D on chip per chip, 6 MB shared / 2 cores |
| Tertiary Cache: | None |
| Other Cache: | None |
| Memory Amount (GB): | 4 |
| # and size of DIMM: | 2 x 2048 MB |
| Memory Details: | PC2-6400E 2Rx8 (CAS 6-6-6) |
| Power Supply Quantity and Rating (W): | 1 x 350 |
| Power Supply Details: | Delta Electronics, Inc DPS-350UB A |
| Disk Drive: | 1 x Seagate (3.5", SATA, 160GB, 7.2krpm) |
| Disk Controller: | Integrated SATA controller |
| # and type of Network Interface Cards (NICs) Installed: | 2 x Broadcom NetXtreme Gigabit Ethernet (onboard) |
| NICs Enabled in Firmware / OS / Connected: | 1/1/1 |
| Network Speed (Mbit): | 1000 |
| Keyboard: | KVM |
| Mouse: | KVM |
| Monitor: | KVM |
| Optical Drives: | No |
| Other Hardware: | None |
| Software | |
|---|---|
| Power Management: | Enabled (Server Balanced Processor Power and Performance) |
| Operating System (OS): | Microsoft Windows Server 2003 R2 Enterprise x64 Edition |
| OS Version: | Version 5.2.3790 Service Pack 1 Build 3790 |
| Filesystem: | NTFS |
| JVM Vendor: | Oracle Corporation |
| JVM Version: | Oracle JRockit(R) 6.0 P27.5.0 (build P27.5.0-5_o_CR371811_CR374296-100684-1.6.0_03-20080702-1651-windows-x86_64) |
| JVM Command-line Options: | -Xms1650m -Xmx1650m -Xns1500m -XXaggressive -Xlargepages -Xgc:genpar -XXcallprofiling -XXgcthreads=2 -XXtlasize:min=4k,preferred=1024k -XXthroughputcompaction |
| JVM Affinity: | start /affinity [0x3,0xC] |
| JVM Instances: | 4 |
| JVM Initial Heap (MB): | 1650 |
| JVM Maximum Heap (MB): | 1650 |
| JVM Address Bits: | 64 |
| Boot Firmware Version: | -- |
| Management Firmware Version: | -- |
| Workload Version: | SSJ 1.1.3 |
| Director Location: | Controller |
| Other Software: | None |
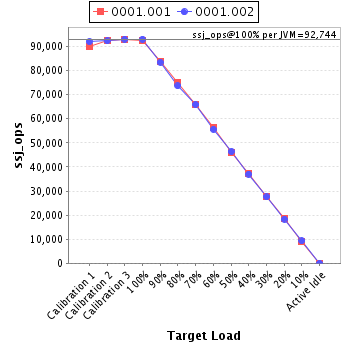
| JVM Instance | ssj_ops@100% |
|---|---|
| 0001.001 | 92,422 |
| 0001.002 | 93,065 |
| ssj_ops@100% | 185,487 |
| ssj_ops@100% per JVM | 92,744 |
| Target Load | Actual Load | ssj_ops | |
|---|---|---|---|
| Target | Actual | ||
| Calibration 1 | 89,941 | ||
| Calibration 2 | 92,591 | ||
| Calibration 3 | 92,839 | ||
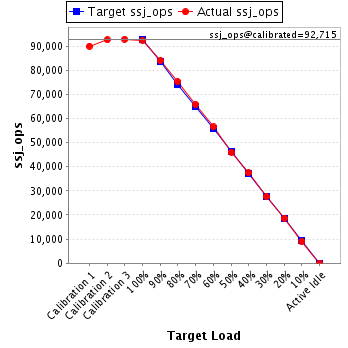
| ssj_ops@calibrated=92,715 | |||
| 100% | 99.7% | 92,715 | 92,422 |
| 90% | 90.6% | 83,444 | 83,996 |
| 80% | 81.1% | 74,172 | 75,204 |
| 70% | 71.0% | 64,901 | 65,821 |
| 60% | 60.9% | 55,629 | 56,453 |
| 50% | 49.5% | 46,358 | 45,927 |
| 40% | 40.3% | 37,086 | 37,408 |
| 30% | 29.8% | 27,815 | 27,654 |
| 20% | 20.2% | 18,543 | 18,736 |
| 10% | 9.9% | 9,272 | 9,141 |
| Active Idle | 0 | 0 | |
| Target Load | Actual Load | ssj_ops | |
|---|---|---|---|
| Target | Actual | ||
| Calibration 1 | 92,020 | ||
| Calibration 2 | 92,347 | ||
| Calibration 3 | 93,072 | ||
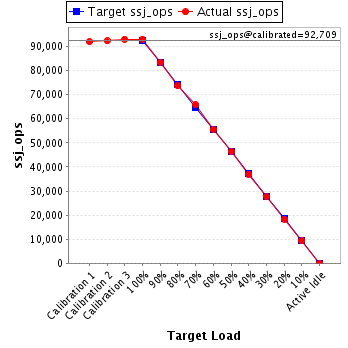
| ssj_ops@calibrated=92,709 | |||
| 100% | 100.4% | 92,709 | 93,065 |
| 90% | 90.1% | 83,439 | 83,512 |
| 80% | 79.4% | 74,168 | 73,654 |
| 70% | 71.0% | 64,897 | 65,817 |
| 60% | 60.0% | 55,626 | 55,645 |
| 50% | 50.0% | 46,355 | 46,378 |
| 40% | 40.0% | 37,084 | 37,072 |
| 30% | 29.7% | 27,813 | 27,529 |
| 20% | 19.8% | 18,542 | 18,358 |
| 10% | 10.0% | 9,271 | 9,295 |
| Active Idle | 0 | 0 | |