|
Eight Benchmark Files
Tested
|
|
Eight standard benchmark files were approved by the GPC project group for use in this round of testing. Here is a description of the files within each category.
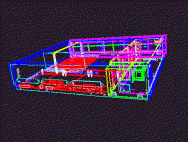 |
sys_chassisThe file designated as "sys_chassis" is a 3D wireframe model of a computer chassis. During the course of the test, the chassis is rotated, panned, zoomed and viewed from different perspectives. The chassis is composed of 6,107 3D solid polylines and 158 3D dashed polylines. The number of vertices per polyline ranges from two to 11; there is a total of 19,064 vectors. Five hundred (500) frames are displayed in this test. |
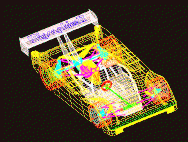 |
race_carThe "race_car" file is a data set representing a 3D wireframe model of a race car that is seen from different views. Unigraphics 3D modeling software was used to create the car model. The model is displayed and animated in four different simultaneous views on the screen. There is an average of 17,917 3D solid polylines containing 141,934 vectors with 129 color attribute changes per frame. The animation sequence contains 600 frames. |
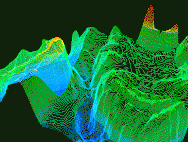 |
seafloorThe "seafloor" file is a 3D wireframe model representing the contour lines of the ocean floor and the islands above. This data is typical of applications that do mapping of seafloor terrain for exploration purposes. Color is used to depict elevations, with deep blue representing the deepest part of the ocean, and red the highest areas above sea level. The sea-level boundary is depicted as a white contour line. While the file is being run, the terrain data is rotated 360 degrees, followed by additional translations and rotations. The data set comprises 984 contour lines on 211 depth levels. Each contour line is represented as solid 3D polylines. There are 540 total frames with an average of 229,682 vectors per frame. |
3D Surface Files
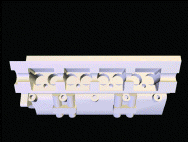 |
cyl_headThe "cyl_head" file contains a 3D solid model of an automobile engine's cylinder head. The test reflects a typical 3D mechanical CAD application. The cylinder head is rotated, translated and zoomed in on during the test. It is composed of 3,621 3D polygons and 32 3D fill-area sets. There is an average of 4.8 vertices per polygon. The fill-area sets have an average of 55.7 vertices and 2.7 contours per frame. There are 225 frames displayed in this test. All colors in this file are true color (RGB) values and all polygons are Gouraud shaded. There are three light sources, which use ambient, diffuse and specular light components. |
 |
headThe "head" file depicts a 3D human head modeled using data generated by a laser scanner. This type of file is typical of applications in animation, special effects, and biomedical areas. The data set consists of nearly 60,000 triangles that are rendered using multiple T-mesh strips. There are four directional light sources illuminating the object as it rotates three times around the Y-axis in 240 frames. |
 |
shuttleThe shuttle file is an example of low-end simulation consisting of 560 frames. The scenario depicts the rendezvous of a space shuttle with a satellite in a low planet orbit. An astronaut uses the shuttle's robot arm to maneuver within repair distance of the satellite. The shuttle and satellite are modeled using quadrilateral meshes, triangle strips, and polygons for a total of 3,355 facets. The planet model consists of quadrilateral meshes totalling 5,632 facets. Constellation data was derived from the BOSS star catalog and is modeled using 2,283 3D markers. Three light sources -- ambient, directional and point -- are used to light the scenes. |
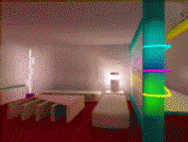 |
studioThe studio file is an architectural walkthrough consisting of 300 frames. The viewer is given a tour of the interior of a photorealistic two-floor design studio, which features light coming from a variety of sources. Lighting conditions are generated using radiosity methods that were precomputed outside the PLB. The file contains 7,518 quadrilaterals in eight MULTI_POLYGON3's; the first seven MULTI_POLYGON3's have 1,000 quads, the last has 518 quads. There are no light sources; shading is accomplished with the vertex colors present on every quad. No facet data is present in the file. |
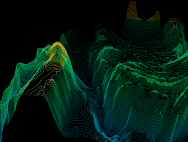 |
oceantopoThe "oceantopo" file is an extension of the database used to produce the current standard benchmark called "seafloor." Like "seafloor," the new file is a 3D wireframe model of the ocean floor contour lines and some islands above. The data is typical of applications that do mapping of seafloor terrain for exploration purposes. Color is used to depict elevations, with deep blue representing the deepest part of the ocean and red the highest areas above sea level. The sea-level boundary is depicted as a white contour line. While the model is being rotated and translated, the depth-cue mapping is changed several times to make the foreground data more visible. The data set comprises 991 contour lines on 211 depth levels. Each contour line is represented as anti-aliased, depth-cued 3D polylines. The file contains a total of 600 frames with an average of 459,809 vectors per frame. |